

Question: Ch 06: Assignment - Risk and Return 12. The Capital Asset Pricing Model and the security market line Wilson holds a portfolio that invests equally
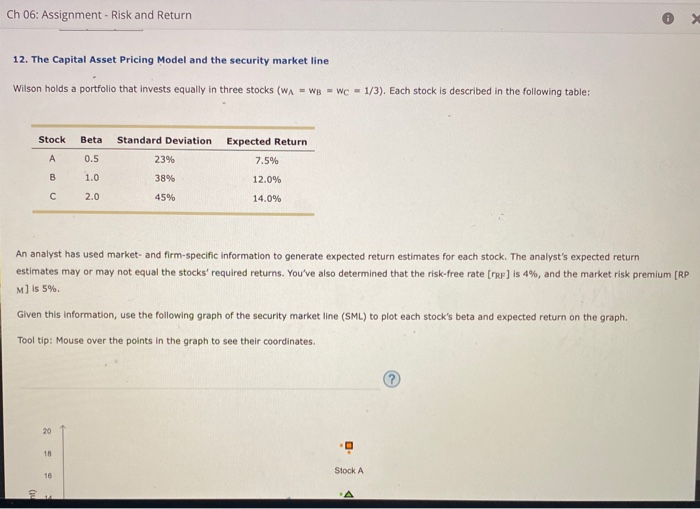
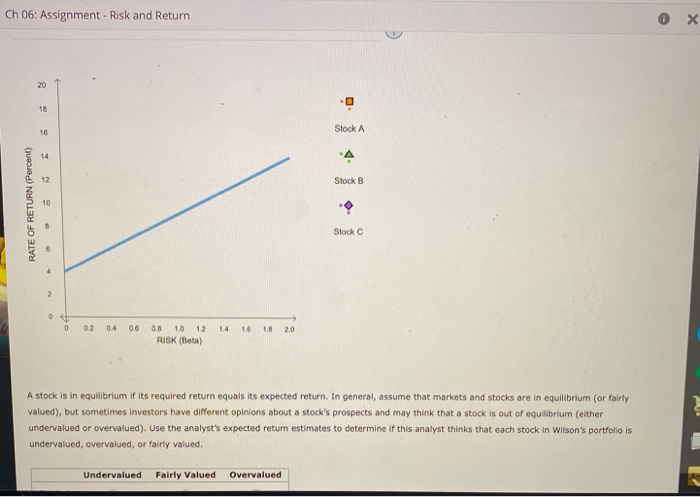
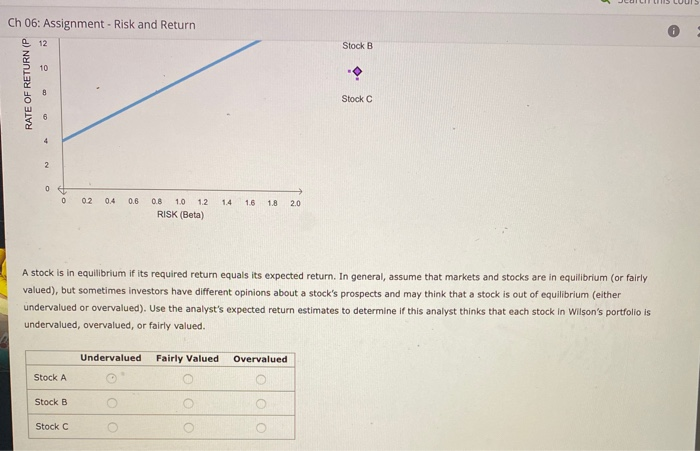
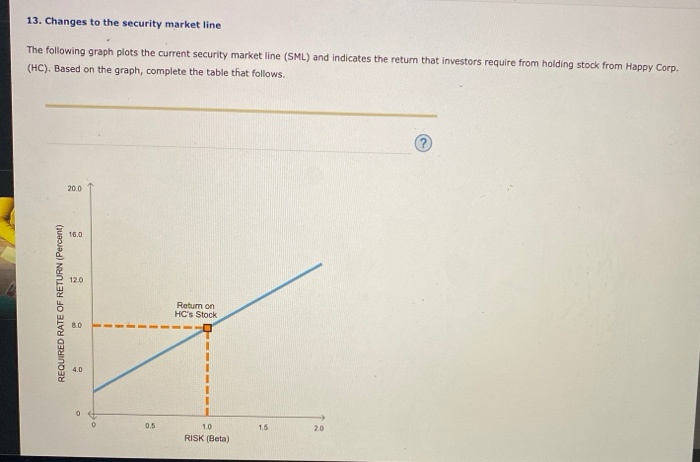
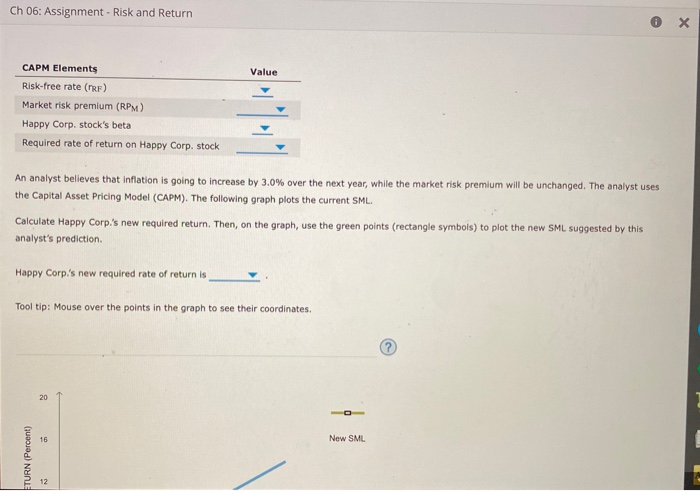
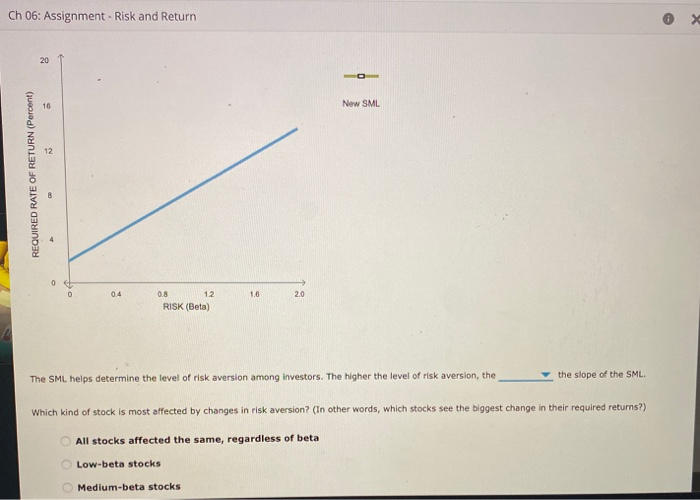
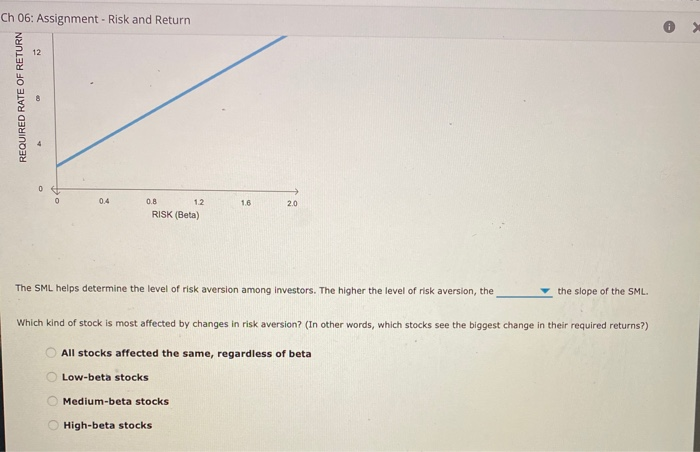
Ch 06: Assignment - Risk and Return 12. The Capital Asset Pricing Model and the security market line Wilson holds a portfolio that invests equally in three stocks (WA = WB = wc - 1/3). Each stock is described in the following table: Stock Beta Expected Return Standard Deviation 23% 0.5 7.5% B 1.0 38% 12.0% 2.0 45% 14.0% An analyst has used market- and firm-specific information to generate expected return estimates for each stock. The analyst's expected return estimates may or may not equal the stocks' required returns. You've also determined that the risk-free rate (Frp) is 4%, and the market risk premium [RP M) is 5%. Given this information, use the following graph of the security market line (SML) to plot each stock's beta and expected return on the graph. Tooltip: Mouse over the points in the graph to see their coordinates. 20 18 Stock A 16 Ch 06: Assignment - Risk and Return X 20 18 16 Stock A A 12 Stock B RATE OF RETURN (Percent) 10 ock C 0 02 04 06 14 16 18 20 0.8 10 12 RISK (Beta) A stock is in equilibrium if its required return equals its expected return. In general, assume that markets and stocks are in equilibrium (or fairly valued), but sometimes Investors have different opinions about a stock's prospects and may think that a stock is out of equilibrium (either undervalued or overvalued). Use the analyst's expected return estimates to determine if this analyst thinks that each stock in Wilson's portfolio is undervalued, overvalued, or fairly valued. Undervalued Fairly Valued Overvalued Ch 06: Assignment - Risk and Return @ 12 Stock B 10 RATE OF RETURN (P Stock C 6 4 2 0 0 0.2 0.4 0.6 1.4 1.6 1.8 2.0 0.8 10 12 RISK (Beta) A stock is in equilibrium if its required return equals its expected return. In general, assume that markets and stocks are in equilibrium (or fairly valued), but sometimes Investors have different opinions about a stock's prospects and may think that a stock is out of equilibrium (either undervalued or overvalued). Use the analyst's expected return estimates to determine if this analyst thinks that each stock in Wilson's portfolio is undervalued, overvalued, or fairly valued. Undervalued Fairly Valued Overvalued Stock A Stock B ololo ololo Stock C 13. Changes to the security market line The following graph plots the current security market line (SML) and indicates the return that investors require from holding stock from Happy Corp. (HC). Based on the graph, complete the table that follows. 20.0 16.0 120 REQUIRED RATE OF RETURN (Percent) Rotum on HC's Stock 80 4.0 0 0 0.5 15 20 1.0 RISK (Beta) Ch 06: Assignment - Risk and Return 0 x Value CAPM Elements Risk-free rate (RF) Market risk premium (RPM) Happy Corp. stock's beta Required rate of return on Happy Corp. stock An analyst believes that inflation is going to increase by 3.0% over the next year, while the market risk premium will be unchanged. The analyst uses the Capital Asset Pricing Model (CAPM). The following graph plots the current SML. Calculate Happy Corp.'s new required return. Then, on the graph, use the green points (rectangle symbols) to plot the new SML suggested by this analyst's prediction Happy Corp's new required rate of return is Tool tip: mouse over the points in the graph to see their coordinates. 20 16 New SML TURN (Percent) 12 Ch 06: Assignment - Risk and Return 20 16 New SML REQUIRED RATE OF RETURN (Percent) 0.4 1.6 2.0 0.8 12 RISK (Beta) The SML helps determine the level of risk aversion among investors. The higher the level of risk aversion, the the slope of the SML Which kind of stock is most affected by changes in risk aversion? (In other words, which stocks see the biggest change in their required returns?) All stocks affected the same, regardless of beta Low-beta stocks Medium-beta stocks Ch 06: Assignment - Risk and Return 12 REQUIRED RATE OF RETURN 0 0.4 1.6 2.0 0.8 1.2 RISK (Beta) The SML helps determine the level of risk aversion among investors. The higher the level of risk aversion, the the slope of the SML. Which kind of stock is most affected by changes in risk aversion? (In other words, which stocks see the biggest change in their required returns?) All stocks affected the same, regardless of beta Low-beta stocks Medium-beta stocks High-beta stocks
Step by Step Solution
There are 3 Steps involved in it

Get step-by-step solutions from verified subject matter experts