

Question: Ch 06 Assignment- Risk and Return following table Stock Beta Standard Deviation Expected Return A 0.5 1.0 C 2.0 23% 38% 45% 7.5% 12.0% 14.0%
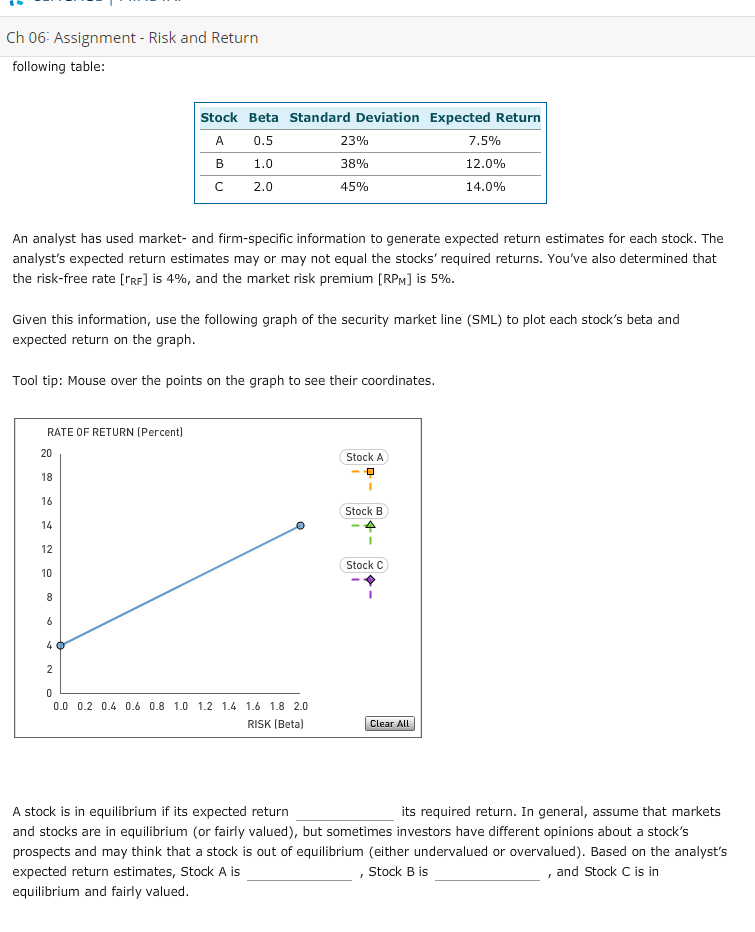
Ch 06 Assignment- Risk and Return following table Stock Beta Standard Deviation Expected Return A 0.5 1.0 C 2.0 23% 38% 45% 7.5% 12.0% 14.0% An analyst has used market- and firm-specific information to generate expected return estimates for each stock. The analyst's expected return estimates may or may not equal the stocks' required returns. You've also determined that the risk-free rate [rRF] is 4%, and the market risk premium [RPm] is 5% Given this information, use the following graph of the security market line (SML) to plot each stock's beta and expected return on the graph Tool tip: Mouse over the points on the graph to see their coordinates RATE OF RETURN (Percent 20 Stock A Stock B 12 Stock C 0.0 0.2 0.4 0.6 0.8 1.0 1.2 1.4 1.6 1.8 2.0 RISK (Beta) A stock is in equilibrium if its expected return and stocks are in equilibrium (or fairly valued), but sometimes investors have different opinions about a stock's prospects and may think that a stock is out of equilibrium (either undervalued or overvalued). Based on the analyst's expected return estimates, Stock A is equilibrium and fairly valued its required return. In general, assume that markets , Stock B is , and Stock C is in
Step by Step Solution
There are 3 Steps involved in it

Get step-by-step solutions from verified subject matter experts