

Question: Ch 09: Assignment-Stocks and Their Valuation 4. Expected dividends as a basis for stock values The fo lowing graph shows the value of a stock's
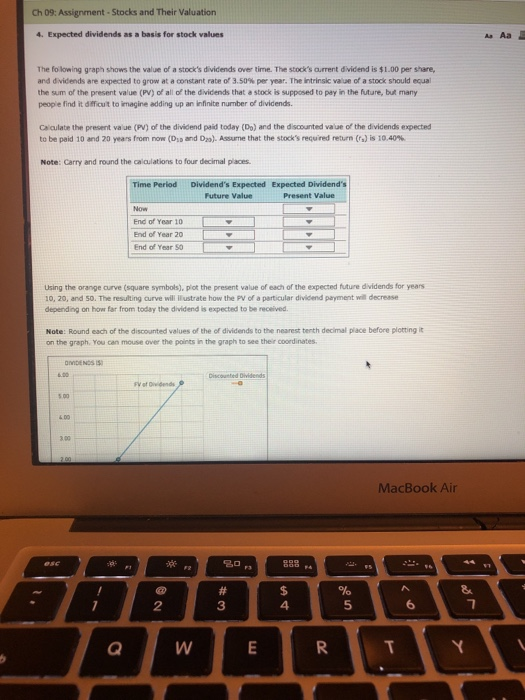
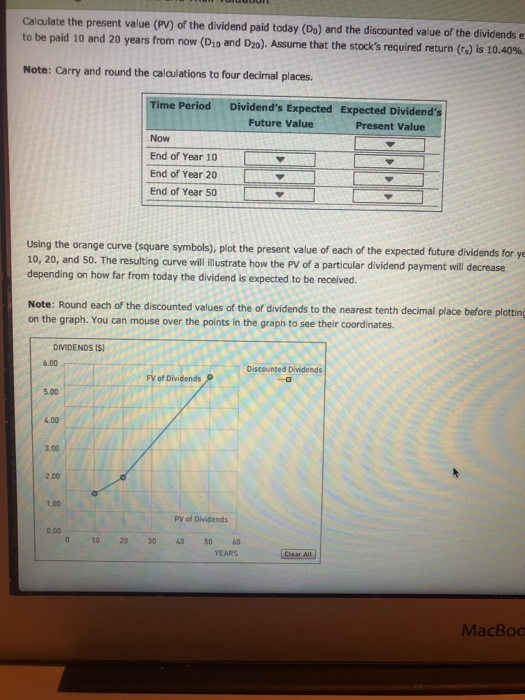
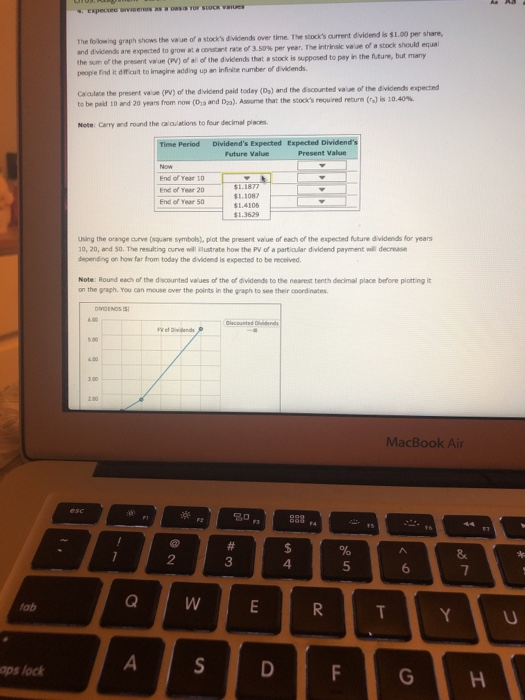
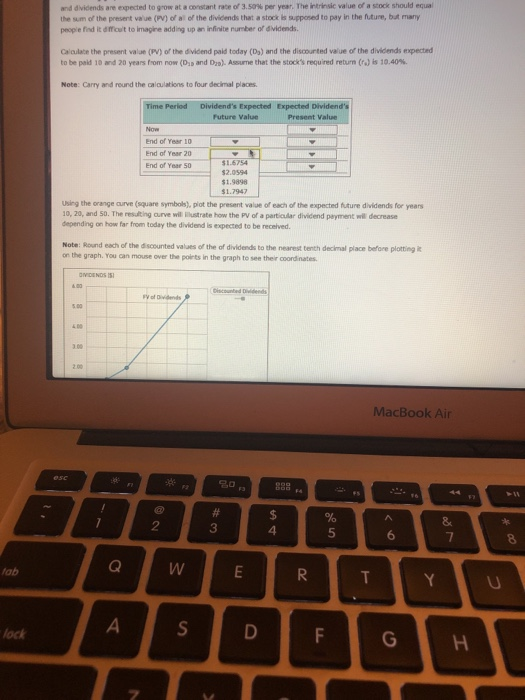
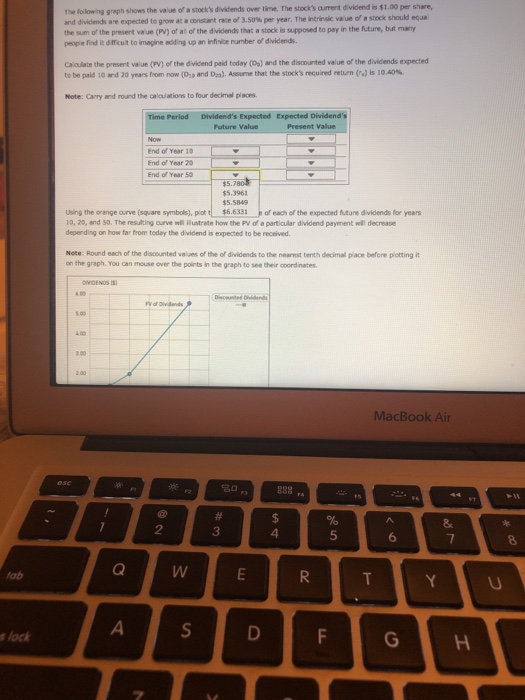
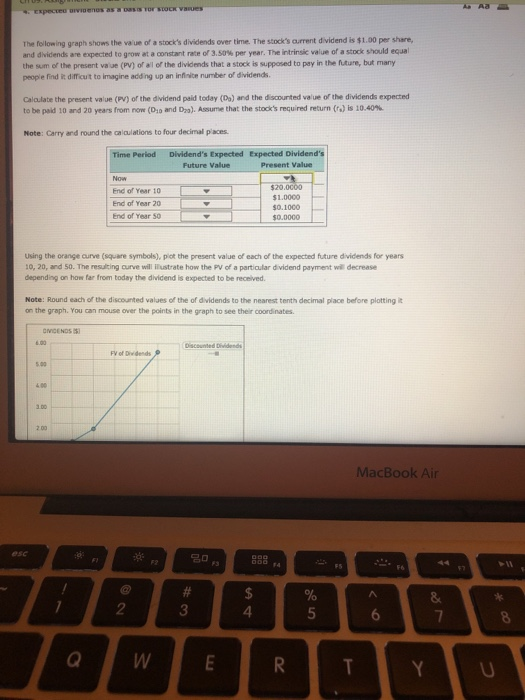
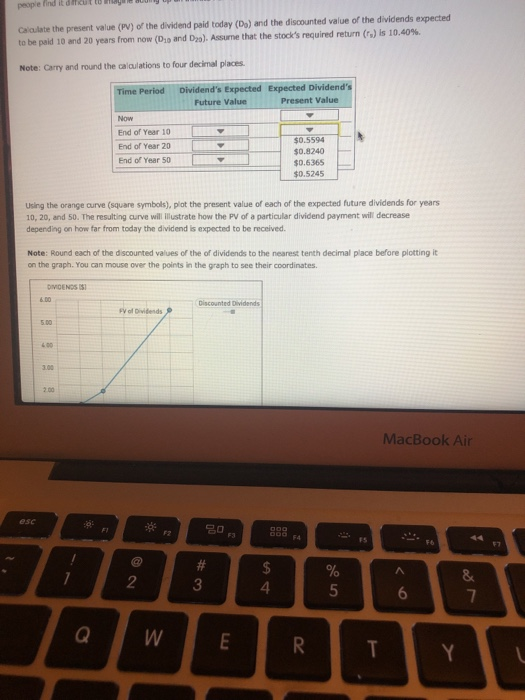
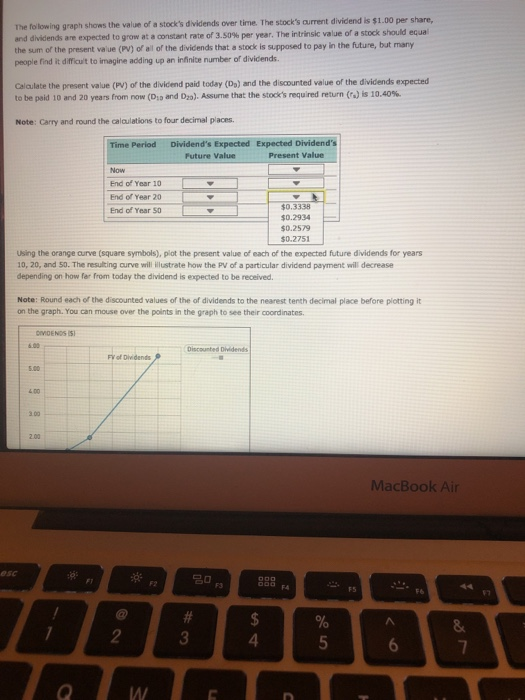
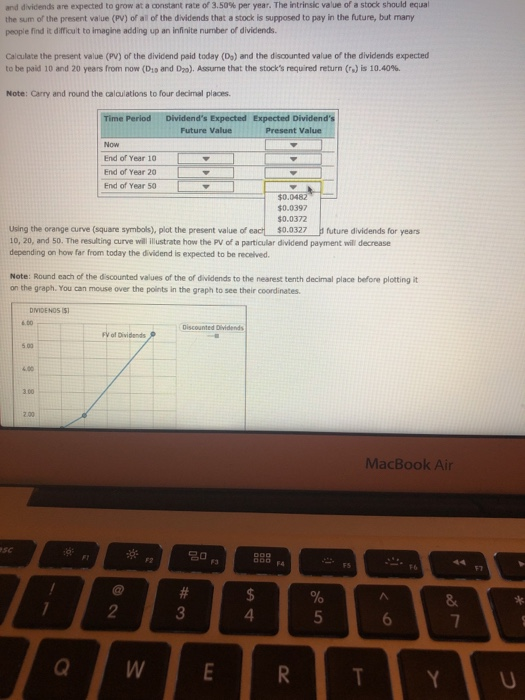
Ch 09: Assignment-Stocks and Their Valuation 4. Expected dividends as a basis for stock values The fo lowing graph shows the value of a stock's dividends over time. The stock's aurrent dividend is $1.00 per share, and dividends are expected to grow at a constant rate of 3.50% per year. The intrinsic vaue of a stock should equal the sum of the present value (PV) of all of the dividends that a stock is supposed to pay in the future, but many peopie find it difficuit to imagine adding up an iInfinite number of dividends. Calculate the present value (PV) of the dividend paid today (Do) and the discounted vaue of the dividends expected to be paid 10 and 20 years from now (DSD and D). Assume that the stock's recured return (r) is 10.40 Note: Carry and round the caiaulations to four decimal places. Expected Dividend's Present Value Time Perlod Dividend's Expected End of Year 10 End of Year 20 End of Year S0 Using the orange curve (square symbols), plot the present value of each of the expected future dividends for yeans 10, 20, and 50. The resulting curve will Wustrate how the PV of a particular dividend payment will decrease depending on how far from today the dividend is expected to be received Note: Round each of the discounted values of the of dividends to the nearest tenth decimal place before plotting it on the graph, You can mouse over the points in the graph to see their coordinates Discousted Dividends MacBook Air 2 3 4 5 6 2 Calculate the present value (PV) of the dividend paid today (Do) and the discounted value of the dividends e to be paid 10 and 20 years from now (D10 and D20). Assume that the stock's required return (a) is 10.40%. Note: Carry and round the calaulations to four decimal places. Time Period Dividend's Expected Expected Dividend's Future Value Present Value Now End of Year 10 End of Year 20 End of Year 50 using the orange curve (square symbols), plot the present value of each of the expected future dividends for ye 10, 20, and 50. The resulting curve willilutrate how the PV of a particular dividend payment will decrease depending on how far from today the dividend is expected to be received. Note: Round each of the discounted values of the of dividends to the nearest tenth decimal place before plotting on the graph. You can mouse over the points in the graph to see their coordinates. DIVIDENDS 6.00 Discounted Dividends FV of Dividends 5.00 4.00 3.00 2.00 1.00 PV of Dividends 0.00 0 10 20 30 40 50 60 YEARS MacBoo The folowing graph shows the vaue of a stock's dividends over time. The stock's aument dividend is $1.00 per share, t a contre rate of 3.50% per year. The intrinsic vave or a stock should equal and dvidends the sum of the present va ue (P) of all of the divicends that a stock is supposed to pey in the future, but people find R d'iut to imagine adding up an infirite number of divicends. are expected to grow Ca aulace the presert valse (PV) of the divicend paid today (Ds) and the discounted value of the dividends expected Note: Carry and roand the ca/ou ations to four decimal places Period Dividend's Expected Expected Dividend's Future Value Present Value end of Year 10-[ End of Year 20 End of Year 50 $1.1877 1.108 1.4106 $1.3629 using the orange curve(square symbols), plot the present value of each of the expected future dividends for years 10,20ard $0. The resulting arve "lustrate how the PV of a particular dividend payment wil rease depending on how far from today the dividend is expected to be received. Note: Round each of the discounted values of the of dividends to the nearest tenth decimal place before plotting it on the graph. You can mouse over the points in the graph to see their coordinates MacBook Air 2 3 4 aps lock and dividends are expected to grow at a constant race o/ 3.50% per year. The intrinsic value of a stock should equal the sum of the presert vaue (PV) oral of the dividends that a sto is 5ppo ed to pay in the Mure, ba many peopie find it difficu/t to imagire adding up an irfinite number of dividends Caloulace the present value (PV) of the dividend paid today (Ds) and the discourted value of the dividends expected to be peld 10 rd 20 years from now (Ds and D29). Assume that the stock's required return (r.) is 10.40%. Note: Carry and round the calculations to four decimal places Future Value Present Value End of Year 10 End of Year 20 End of Year 50 1.6754 $2.0594 1.9898 $1.7947 Using the orange curve (square symbols), plot the present value of each of the expected future dividends for years 10, 20, and 50. The resulting arve ilstrate how the PV of a particular dividend payment decrease depending on how far from today the dividend is expected to be received Note: Round each of the discounted values of the of dividends to the nearest tenth deckmal place before plotting i on the graph. You can mouse over the points in the graph to see their coordinates MDENDS1 MacBook Air 1 7 2 3 lock h shows the value of a stock's dividends over time. The stock's aurrent dividend is $1.00 per share, nd dividends are expected to grow at a onstant rate o/ 3.50% year. The intrisk veue or a stock should equa the sum of the present value (PV) of al of the dividends that a stock is supposed to pay in the future, but many peopie find it difficuit to imagine adding up an infinice number of dividends. Calulate the presert value (PV) of the dvidend paid today (Da) and the discounted value of the dividends expected to be paid i"nd 20 years noen now (Ds and Daa). Assume that the stock's required return (rs) bs aos Note: Carry and round the cala/ations to four decimal places s Expected Expected D Present Value End of Year 10 End of Year 20 End of Year 50 $5.3961 5.5849 using the orange curve (square symbols), plot t$6.6331 oeach of the expected future dividends for years 10, 2o, and so. The resiting arve sustrate how the PV of a partialar dividend payment wil decrease deperding on how far from today the dividend is expected to be received Note: Round each of the discounted values of the of dividends to the nearest tenth decimal place befcre plotting it on the graph. You can mouse over the points in the graph to see their coord nates MacBook Air 3 4 5 6 s lock The following graph shows the voue of a stock's dividends over time. The stock's ament dividend is $1.00 per share, and dividends are expected to grow at a constant rate or 3.50% per year. The intrinsic value of a stock should equal the sum of the present value (PV) of all of the dividends that a stock is supposed to pay in the future, but many people find it difficut to imagine adding up an infinice number of dividends Calaulate the present value (PV) of the dividend paid today (Ds) and the discounted value of the dividends expected to be paid 10 and 20 years rrom row (Do and Dro). Assume that the stock's required return is 10.40% Note: Carry and round the alations to four decimal places. Period Dividend's Expected Expected Dividend Future Value Present Value End of Year 10 End of Year 20 End of Year 50 $20 $1.0000 $0.1000 Using the orange curve (square symbols), piot the present value of each of the expected future dividends for years 10, 20, and 50. The resulting curve will ilustrate how the PV of a partiaular dividend payment will decrease depending on how far from today the dividend is expected to be received. Note: Round each of the discounted values of the of dividends to the nearest tenth decimal place before plotting it on the graph. You can mouse over the points in the graph to see their coordinates. Discounted Dvides FV of Divi dends s.00 MacBook Air 2 3 4 shows the value of a stock's dividends over time. The stock's current dividend is $1.00 per share, The folowing graph and dividends are expected to grow at a constant rate of 3.50% per year. The intrinsic value of a stock should ecual the sum of the present value (PV) of all of the diviends that a stock is supposed to pay in the future, but many people find it difficu/t to imagine adding up an infinite number of divicends. Calaulate the present value (PV) of the divicend paid today (Da) and the discounted value of the dividends expected to be paid 10 and 20 years from now (D13 and D29). Assume that the stock's requred return (r) is 10.40%. Note: Carry and round the calaulations to four decimal places Time Period Dividend's Expected Expected Dividend's Future Value Present Value End of Year 10 End of Year 20 End of Year So $0.3338 $0.2934 $0.2579 $0.2751 Using the orange curve (square symbols), plot the present value of each of the exxpected future dividends for years 10, 20, and 50. The resulting curve will illustrate how the PV of a particular dividend pyment will decrease depending on how fer from today the dividend is expected to be received Note: Round each of the discounted values of the of dividends to the nearest tenth decimal place before plotting it on the graph. You can mouse over the points in the graph to see their coordinates. Fy of Dividends MacBook Air 0 FS F6 8 2 4 6 A/ ard dividends are expected to grow at a constant rate or 3.50% per year. The intrinsic value a stock should equal the sum of the present value (PV) of all of the dividends that a stock is supposed to pay in the future, but many people find it difficu't to imagine adding up an infinite number of dividends of Calculate the present value (PV) of the dividend paid today (Do) and the discounted value of the dividends expected to be paid 10 and 20 years from now (D13 and D20). Assume that the stock's requred return (r) is 10.40%. Note: Carry and round the calaulations to four decimal places. Time Period Dividend's Expected Expected Dividend's Future Value Present Value Now End of Year 10 End of Year 20 End of Year 50 $0.0482 $0.0397 $0.0372 Using the orange curve (square symbols), plot the present value of eact $0.0327future dividends for years 10, 20, and 50. The resulting curve will illuistrate how the PV of a particular dividend payment will decrease depending on how far from today the dividend is expected to be recelived Note: Round each of the discounted values of the of dividends to the nearest tenth decimal place before plotting it on the graph. You can mouse over the points in the graph to see their coordinates. Discounted Dividends of Dividends 3.00 2.00 MacBook Air sc 2 3 4
Step by Step Solution
There are 3 Steps involved in it

Get step-by-step solutions from verified subject matter experts