

Question: Ch. 13 P. 6-8 Required information Problem 13-2A Ratios, common-size statements, and trend percents LO P1, P2, P3 [The following information applies to the questions
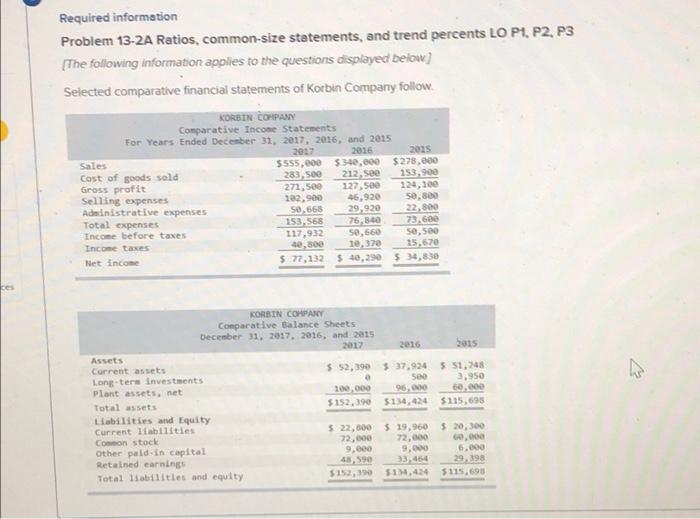
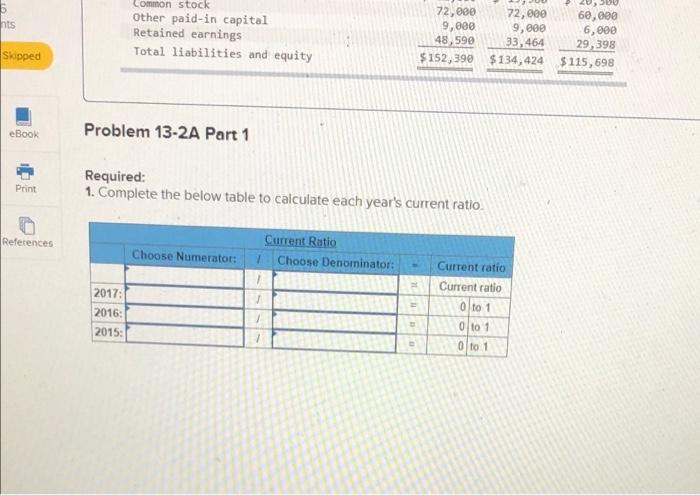
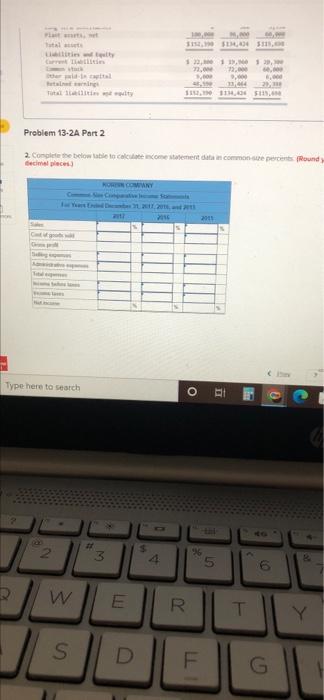
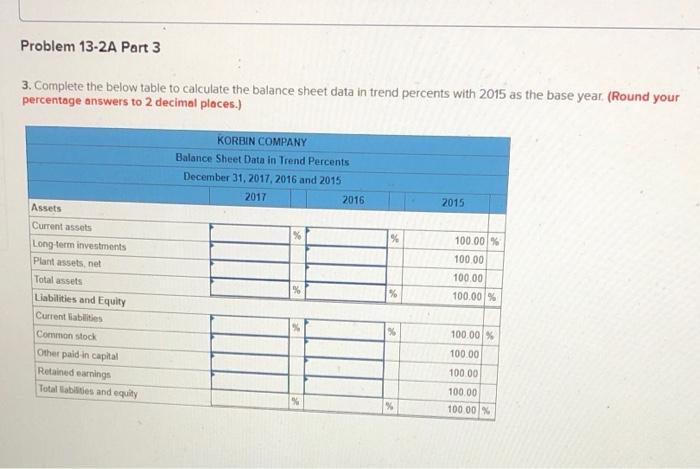
Required information Problem 13-2A Ratios, common-size statements, and trend percents LO P1, P2, P3 [The following information applies to the questions displayed below) Selected comparative financial statements of Korbin Company follow KORSIN COMPANY Comparative Income Statements For Years Ended December 31, 2017, 2016, and 2015 Sales Cost of goods sold Gross profit Selling expenses Administrative expenses Total expenses Income before taxes Income taxes Net income 2017 2016 2015 5555,000 $340,000 $278,000 283,500 212, see 153.900 271,500 127. See 224,100 202,900 46,920 50.800 50.668 29.920 22,800 153.568 76.340 23.600 117,932 50,660 2.500 40,500 10,370 15,670 $ 77,132 540,290 5 34,830 KORRIN COMPANY Comparative Balance Sheets December 31, 2017, 2016, and 2015 2017 2016 2015 Assets Current assets $ 52,390 $ 37,924 551,248 Long-ters Investments SONO 3,950 plant assets, net 96,000 Total assets $152,390 5134,424 $115,698 Liabilities and Equity Current liabilities $ 22,00 $ 19,960 $ 20,300 Coon stock 72,000 72,00 6,00 Other paid in capital 9,000 9.000 6.000 Retained earnings 43,590 33,464 29, 398 Total liabilities and equity 5152,390 $234,424 5115,693 Common stock nts Other paid-in capital Retained earnings Total liabilities and equity 72,000 72,000 9,000 9,000 48,590 33,464 $152,399 $134,424 68,890 6,000 29,398 $115,698 Skipped eBook Problem 13-2A Part 1 Print Required: 1. Complete the below table to calculate each year's current ratio. References Choose Numerator: Current Ratio 1 Choose Denominator: 2017: 1 2016: Current ratio Current ratio 0 to 1 Oto 1 0 to 1 2015: Listy attal 11, 7, . . . 8.000 2014 2 Problem 13-2 Part 2 2. Concette below able to come statement de commerces found decimal places MOCOWANY 2011 Type here to search O El E 0 2 M 3 96 4 5 6 W E R 20 T Y S D F G Problem 13-2A Part 3 3. Complete the below table to calculate the balance sheet data in trend percents with 2015 as the base year. (Round your percentage answers to 2 decimal places.) KORBIN COMPANY Balance Sheet Data in Trend Percents December 31, 2017, 2016 and 2015 2017 2016 2015 % % 100.00% 100.00 100.00 100,00 % % Assets Current assets Long term investments Plant assets, net Total assets Liabilities and Equity Current Kabilities Common stock Other paid in capital Retained earnings Totaltabates and equity % % 100.00 % 100.00 10000 100.00 100.00 %
Step by Step Solution
There are 3 Steps involved in it

Get step-by-step solutions from verified subject matter experts