

Question: (Ch 14-prob set-Q5) please answer all the questions by finding the numerical values that complete the statement to make it true. Note: for the last
(Ch 14-prob set-Q5) please answer all the questions by finding the numerical values that complete the statement to make it true. Note: for the last two statements the answer answer options are "positive" or "negative". All other answer options for the statements are numerical values.
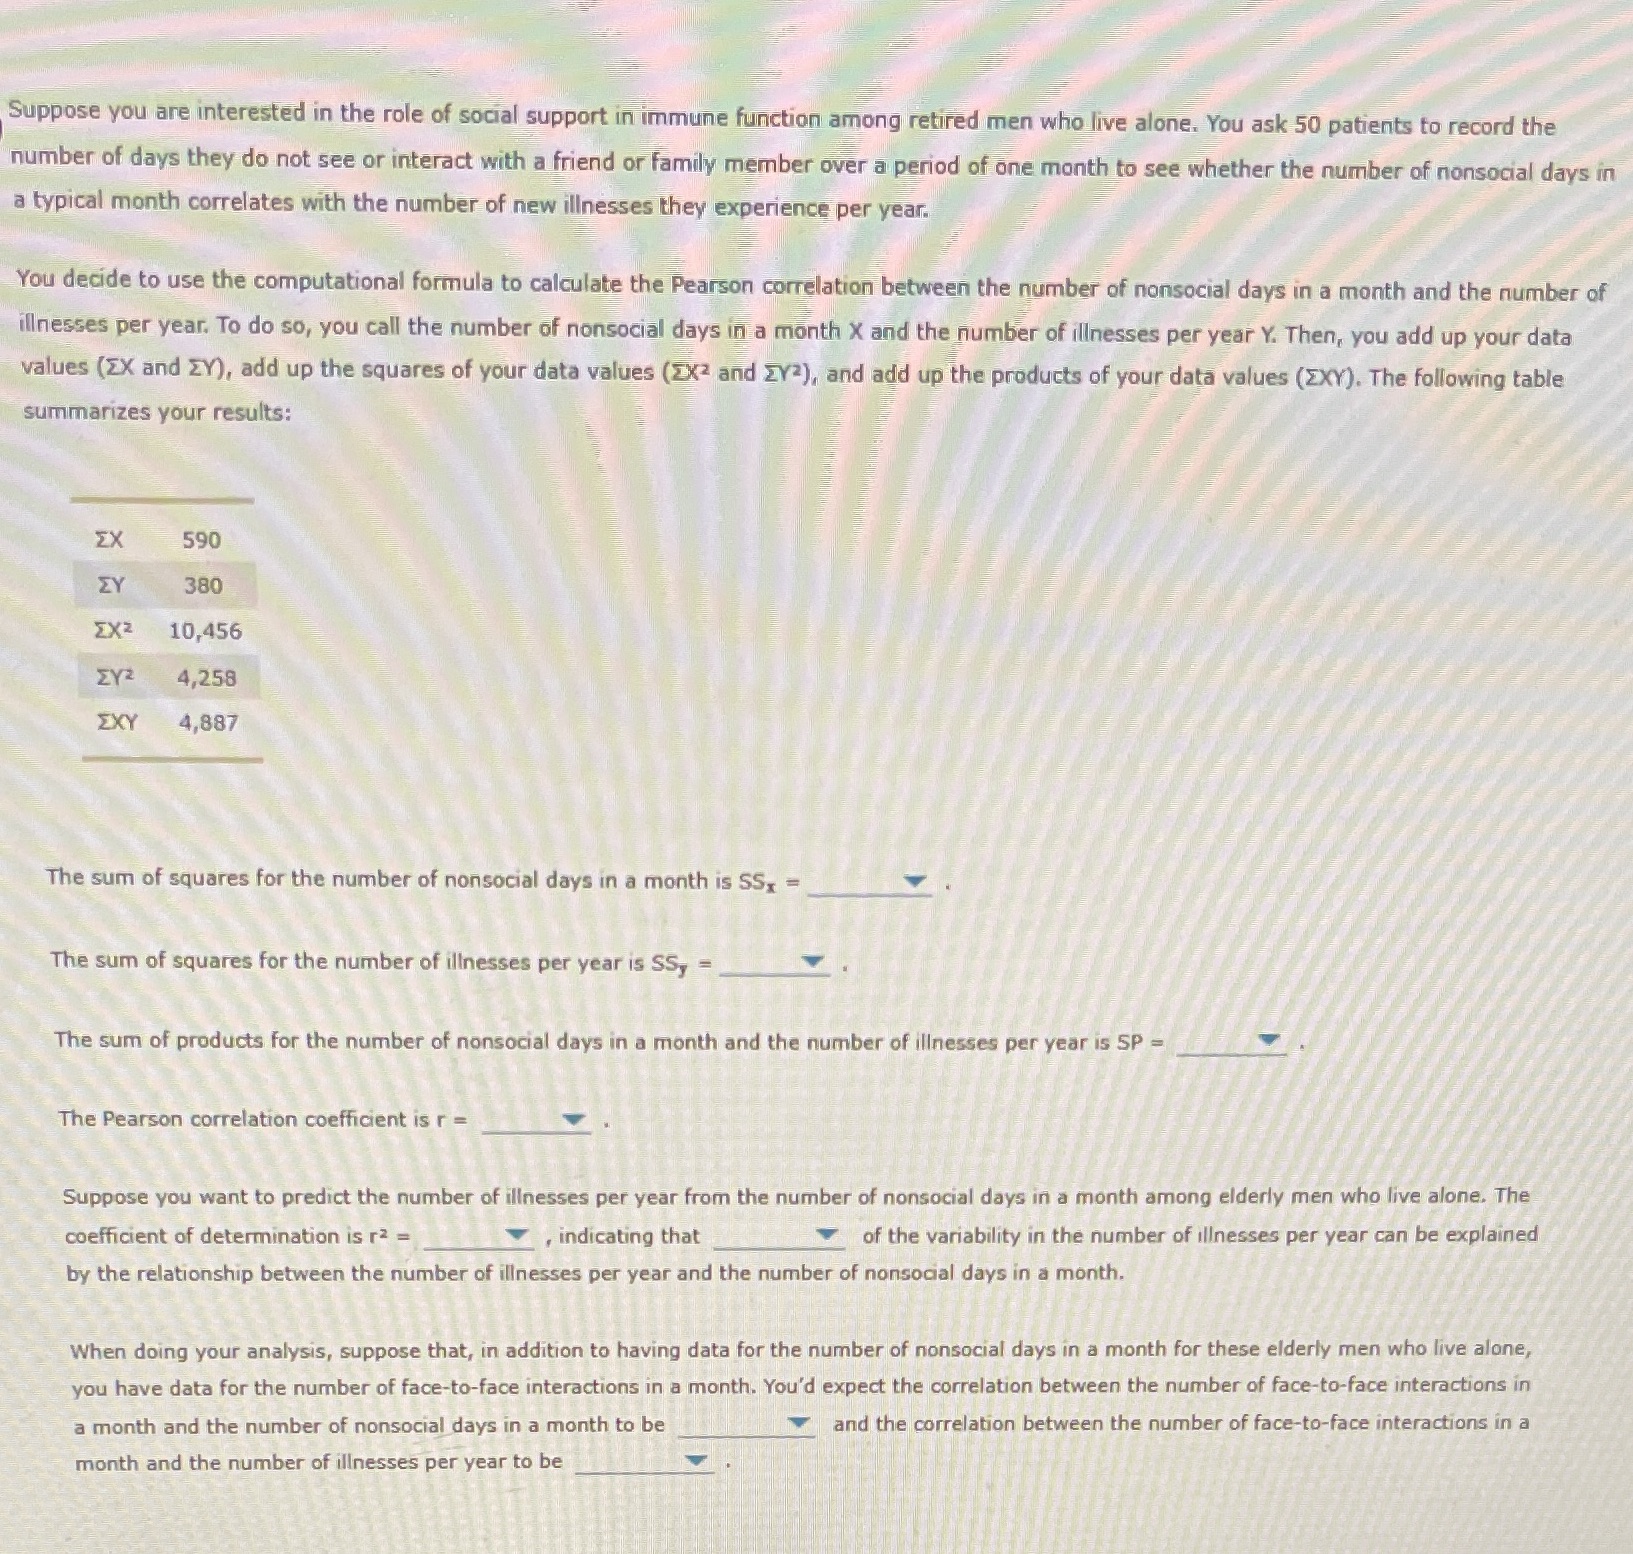
Suppose you are interested in the role of social support in immune function among retired men who live alone. You ask 50 patients to record the number of days they do not see or interact with a friend or family member over a period of one month to see whether the number of nonsocial days in a typical month correlates with the number of new illnesses they experience per year. You decide to use the computational formula to calculate the Pearson correlation between the number of nonsocial days in a month and the number of illnesses per year. To do so, you call the number of nonsocial days in a month X and the number of illnesses per year Y. Then, you add up your data values (ZX and ZY), add up the squares of your data values (2X2 and ZY2), and add up the products of your data values (EXY). The following table summarizes your results: EX 590 ZY 380 EXZ 10,456 EY2 4,258 EXY 4,887 The sum of squares for the number of nonsocial days in a month is SS. = The sum of squares for the number of illnesses per year is SS, = The sum of products for the number of nonsocial days in a month and the number of illnesses per year is SP = The Pearson correlation coefficient is r = Suppose you want to predict the number of illnesses per year from the number of nonsocial days in a month among elderly men who live alone. The coefficient of determination is r2 = , indicating that of the variability in the number of illnesses per year can be explained by the relationship between the number of illnesses per year and the number of nonsocial days in a month. When doing your analysis, suppose that, in addition to having data for the number of nonsocial days in a month for these elderly men who live alone, you have data for the number of face-to-face interactions in a month. You'd expect the correlation between the number of face-to-face interactions in a month and the number of nonsocial days in a month to be and the correlation between the number of face-to-face interactions in a month and the number of illnesses per year to be
Step by Step Solution
There are 3 Steps involved in it

Get step-by-step solutions from verified subject matter experts