

Question: Ch 17: Mastery Assignment - Time Series Analysis and Forecasting One out of every seven transactions at Starbucks is paid for with a Starbucks card:
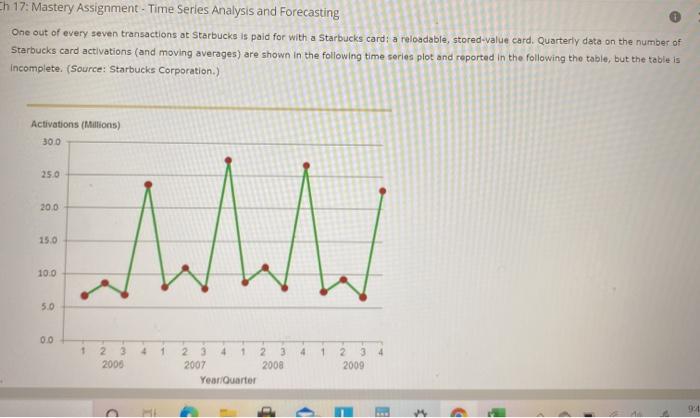
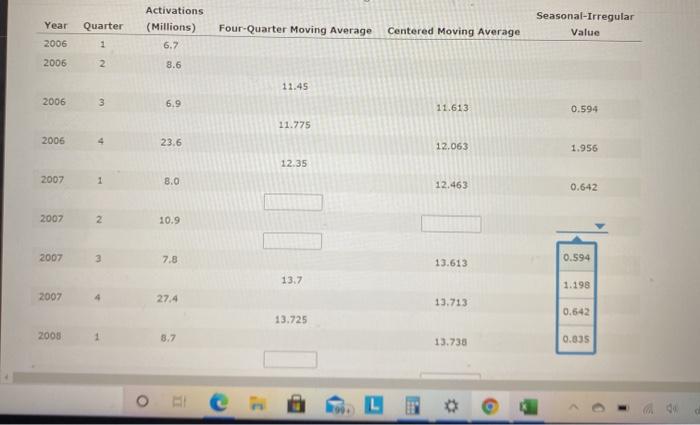
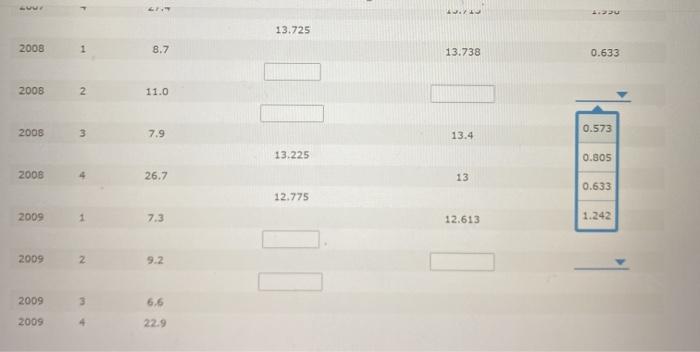
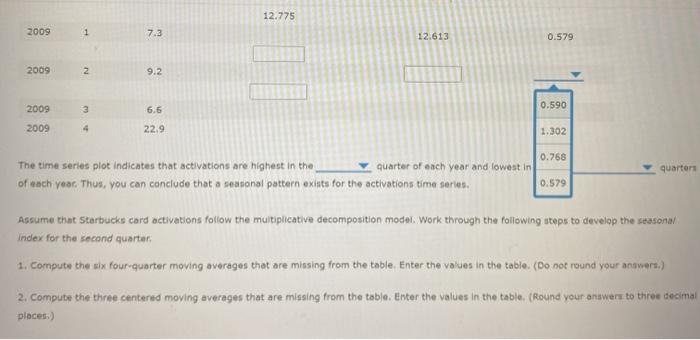

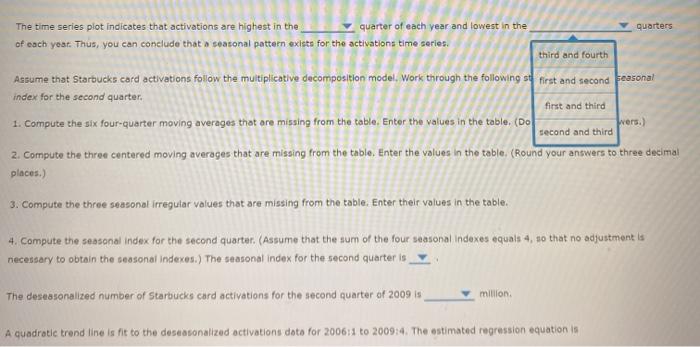
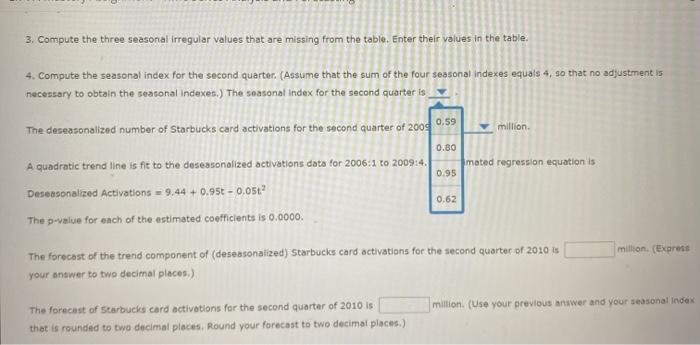
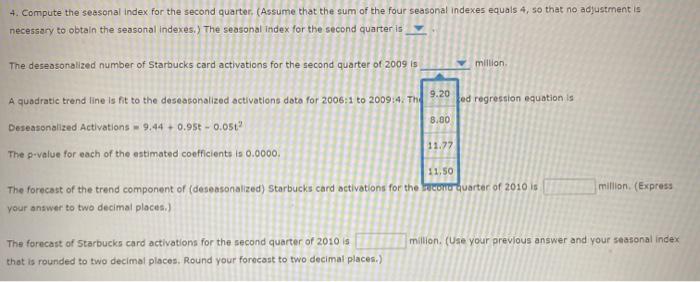
Ch 17: Mastery Assignment - Time Series Analysis and Forecasting One out of every seven transactions at Starbucks is paid for with a Starbucks card: a reloadable, stored-value card. Quarterly date on the number of Starbucks card activations and moving averages) are shown in the following time series plot and reported in the following the table, but the table is Incomplete. (Source: Starbucks Corporation) Activations (Mutions) 300 250 20.0 15.0 10.0 5.0 0.0 + 4 1 4 2 3 2000 23 2 3 2007 2008 Year Quarter 2 2009 . - 0 3 - Year Activations (Millions) 6.7 Quarter 1 Four Quarter Moving Average Seasonal-Irregular Value Centered Moving Average 2006 2006 2. 8.6 11.45 2006 3 6.9 11.613 0.594 11.775 2006 23.6 12.063 1.956 12.35 2007 1 8.0 12.463 0.642 2007 2 10.9 2007 3 7.8 0.594 13.613 13.7 1.198 2007 27.4 13.713 0.542 13.725 2008 8.7 13.738 0.8.JS w . 1. 13.725 2008 1 8.7 13.738 0.633 2008 2 11.0 2008 3 7.9 0.573 13.4 13.225 0.805 2008 26.7 13 0.633 12.775 2009 1 7.3 12.613 1.242 2009 2 9.2 2009 3 6.6 2009 4 22.9 12.775 12.775 2009 1 7.3 12.613 12.613 0.579 2009 2 9.2 2009 3 6.5 0.590 2009 4 22.9 1.302 0.768 quarters The time series plot indicates that activations are highest in the quarter of each year and lowest in of each year. Thus, you can conclude that a seasonal pattern exists for the activations time series. 0.579 Assume that Starbucks card activations follow the multiplicative decomposition model Work through the following steps to develop the seasonal Index for the second quarter 1. Compute the six four-quarter moving averages that are missing from the table Enter the values in the table. (Do not round your answers.) 2. Compute the three centered moving averages that are missing from the table. Enter the values in the table, (Round your answers to three decimal places.) quarters The time series plot indicates that activations are highest in the quarter of each year and lowest in the of each year. Thus, you can conclude that a seasonal pattern exi activations time series fourth Assume that Starbucks card activations follow the multiplicative third kition model, Work through the following steps to develop the seasonal index for the second quarter. 1. Compute the six four-quarter moving averages that are misi he table. Enter the values in the table. (Do not round your answers.) second 2. Compute the three centered moving averages that are missing from the table. Enter the values in the table. (Round your answers to three decimal places.) 3. Compute the three seasonal irregular values that are missing from the table. Enter their values in the table. 4. Compute the seasonal index for the second quarter. (Assume that the sum of the four seasonal Indexes equals 4, so that no adjustment is necessary to obtain the seasonal Indexes.) The seasonal index for the second quarter is The deseasonalized number of Starbucks card activations for the second quarter of 2009 is million A quadratic trendline is fit to the deseasonalized activations data for 2006:1 to 2009:4. The estimated regression equation is 9:41 > 99 . FN % 5 & 7 4 6 8 9 0 E R T Y U P Quarters The time series plot indicates that activations are highest in the quarter of each year and lowest in the of each year. Thus, you can conclude that a seasonal pattern exists for the activations time series. third and fourth first and third Assume that Starbucks card activations follow the multiplicative decomposition model, Work through the following first and second seasonal index for the second quarter. 1. Compute the six four-quarter moving averages that are missing from the table. Enter the values in the table. (Do 2. Compute the three centered moving averages that are missing from the table. Enter the values in the table. (Round your answers to three decimal places.) fvers.) second and third 3. Compute the three seasonal irregular values that are missing from the table. Enter their values in the table. 4. Compute the seasonal index for the second quarter. (Assume that the sum of the four seasonal Indexes equals 4, 10 that no adjustment is necessary to obtain the seasonal Indexes.) The seasonal index for the second quarter is The deseasonalized number of Starbucks card activations for the second quarter of 2009 is million A quadratic trendline is fit to the deseasonalized activations data for 2006:1 to 2009:4. The estimated regression equation is 3. Compute the three seasonal irregular values that are missing from the table. Enter their values in the table. 4. Compute the seasonal index for the second quarter. (Assume that the sum of the four seasonal indexes equals 4, so that no adjustment is necessary to obtain the seasonal Indexes.) The seasonal Index for the second quarter is 0.59 The deseasonalized number of Starbucks card activations for the second quarter of 2009 million 0.80 A quadratic trendline is fit to the deseasonalized activations data for 2006:9 to 2009:4, mated regression equation is 0.95 Deseasonalized Activations = 9,44 +0.95 -0.05t? 0.62 The p-value for each of the estimated coefficients is 0.0000. million (Express The forecast of the trend component of (deseasonalized) Starbucks card activations for the second quarter of 2020 is your answer to two decimal places) million (Use your previous answer and your seasonal Index The forecast of Starbucks card activations for the second quarter of 2010 is that is rounded to two decimal places. Round your forecast to two decimal places.) 4. Compute the seasonal Index for the second quarter, (Assume that the sum of the four seasonal indexes equals 4, so that no adjustment is necessary to obtain the seasonal indexes. The seasonal index for the second quarter is The deseasonalized number of Starbucks card activations for the second quarter of 2009 is million 9.20 ed regression equation is A quadratic trendline is fit to the deseasonalized activations data for 2006:1 to 2009:4. The 8.80 Deseasonalized Activations - 9,44 +0.95 -0.05t? The p-value for each of the estimated coefficients is 0.0000. 11.77 11.50 million (Express The Forecast of the trend component of (desensonalized) Starbucks card activations for the bacomo Guarter of 2010 is your answer to two decimal places.) million (Use your previous answer and your seasonal index The forecast of Starbucks card activations for the second quarter of 2010 is that is rounded to two decimal places. Round your forecast to two decimal places.) Ch 17: Mastery Assignment - Time Series Analysis and Forecasting One out of every seven transactions at Starbucks is paid for with a Starbucks card: a reloadable, stored-value card. Quarterly date on the number of Starbucks card activations and moving averages) are shown in the following time series plot and reported in the following the table, but the table is Incomplete. (Source: Starbucks Corporation) Activations (Mutions) 300 250 20.0 15.0 10.0 5.0 0.0 + 4 1 4 2 3 2000 23 2 3 2007 2008 Year Quarter 2 2009 . - 0 3 - Year Activations (Millions) 6.7 Quarter 1 Four Quarter Moving Average Seasonal-Irregular Value Centered Moving Average 2006 2006 2. 8.6 11.45 2006 3 6.9 11.613 0.594 11.775 2006 23.6 12.063 1.956 12.35 2007 1 8.0 12.463 0.642 2007 2 10.9 2007 3 7.8 0.594 13.613 13.7 1.198 2007 27.4 13.713 0.542 13.725 2008 8.7 13.738 0.8.JS w . 1. 13.725 2008 1 8.7 13.738 0.633 2008 2 11.0 2008 3 7.9 0.573 13.4 13.225 0.805 2008 26.7 13 0.633 12.775 2009 1 7.3 12.613 1.242 2009 2 9.2 2009 3 6.6 2009 4 22.9 12.775 12.775 2009 1 7.3 12.613 12.613 0.579 2009 2 9.2 2009 3 6.5 0.590 2009 4 22.9 1.302 0.768 quarters The time series plot indicates that activations are highest in the quarter of each year and lowest in of each year. Thus, you can conclude that a seasonal pattern exists for the activations time series. 0.579 Assume that Starbucks card activations follow the multiplicative decomposition model Work through the following steps to develop the seasonal Index for the second quarter 1. Compute the six four-quarter moving averages that are missing from the table Enter the values in the table. (Do not round your answers.) 2. Compute the three centered moving averages that are missing from the table. Enter the values in the table, (Round your answers to three decimal places.) quarters The time series plot indicates that activations are highest in the quarter of each year and lowest in the of each year. Thus, you can conclude that a seasonal pattern exi activations time series fourth Assume that Starbucks card activations follow the multiplicative third kition model, Work through the following steps to develop the seasonal index for the second quarter. 1. Compute the six four-quarter moving averages that are misi he table. Enter the values in the table. (Do not round your answers.) second 2. Compute the three centered moving averages that are missing from the table. Enter the values in the table. (Round your answers to three decimal places.) 3. Compute the three seasonal irregular values that are missing from the table. Enter their values in the table. 4. Compute the seasonal index for the second quarter. (Assume that the sum of the four seasonal Indexes equals 4, so that no adjustment is necessary to obtain the seasonal Indexes.) The seasonal index for the second quarter is The deseasonalized number of Starbucks card activations for the second quarter of 2009 is million A quadratic trendline is fit to the deseasonalized activations data for 2006:1 to 2009:4. The estimated regression equation is 9:41 > 99 . FN % 5 & 7 4 6 8 9 0 E R T Y U P Quarters The time series plot indicates that activations are highest in the quarter of each year and lowest in the of each year. Thus, you can conclude that a seasonal pattern exists for the activations time series. third and fourth first and third Assume that Starbucks card activations follow the multiplicative decomposition model, Work through the following first and second seasonal index for the second quarter. 1. Compute the six four-quarter moving averages that are missing from the table. Enter the values in the table. (Do 2. Compute the three centered moving averages that are missing from the table. Enter the values in the table. (Round your answers to three decimal places.) fvers.) second and third 3. Compute the three seasonal irregular values that are missing from the table. Enter their values in the table. 4. Compute the seasonal index for the second quarter. (Assume that the sum of the four seasonal Indexes equals 4, 10 that no adjustment is necessary to obtain the seasonal Indexes.) The seasonal index for the second quarter is The deseasonalized number of Starbucks card activations for the second quarter of 2009 is million A quadratic trendline is fit to the deseasonalized activations data for 2006:1 to 2009:4. The estimated regression equation is 3. Compute the three seasonal irregular values that are missing from the table. Enter their values in the table. 4. Compute the seasonal index for the second quarter. (Assume that the sum of the four seasonal indexes equals 4, so that no adjustment is necessary to obtain the seasonal Indexes.) The seasonal Index for the second quarter is 0.59 The deseasonalized number of Starbucks card activations for the second quarter of 2009 million 0.80 A quadratic trendline is fit to the deseasonalized activations data for 2006:9 to 2009:4, mated regression equation is 0.95 Deseasonalized Activations = 9,44 +0.95 -0.05t? 0.62 The p-value for each of the estimated coefficients is 0.0000. million (Express The forecast of the trend component of (deseasonalized) Starbucks card activations for the second quarter of 2020 is your answer to two decimal places) million (Use your previous answer and your seasonal Index The forecast of Starbucks card activations for the second quarter of 2010 is that is rounded to two decimal places. Round your forecast to two decimal places.) 4. Compute the seasonal Index for the second quarter, (Assume that the sum of the four seasonal indexes equals 4, so that no adjustment is necessary to obtain the seasonal indexes. The seasonal index for the second quarter is The deseasonalized number of Starbucks card activations for the second quarter of 2009 is million 9.20 ed regression equation is A quadratic trendline is fit to the deseasonalized activations data for 2006:1 to 2009:4. The 8.80 Deseasonalized Activations - 9,44 +0.95 -0.05t? The p-value for each of the estimated coefficients is 0.0000. 11.77 11.50 million (Express The Forecast of the trend component of (desensonalized) Starbucks card activations for the bacomo Guarter of 2010 is your answer to two decimal places.) million (Use your previous answer and your seasonal index The forecast of Starbucks card activations for the second quarter of 2010 is that is rounded to two decimal places. Round your forecast to two decimal places.)
Step by Step Solution
There are 3 Steps involved in it

Get step-by-step solutions from verified subject matter experts