

Question: CH Exercise 11-11 Net present value, profitability index LO P3 Following is information on two alternative investments being considered by Tiger Co. The company requires
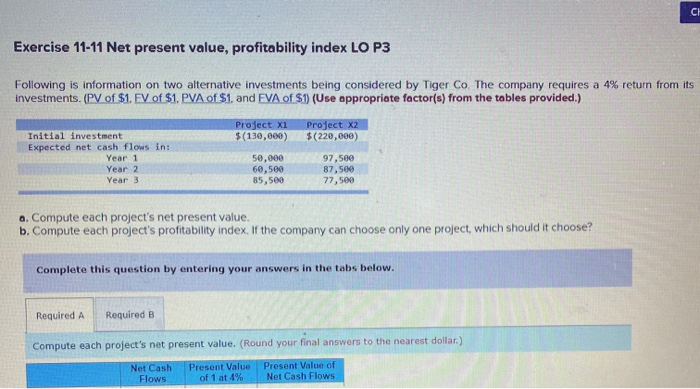
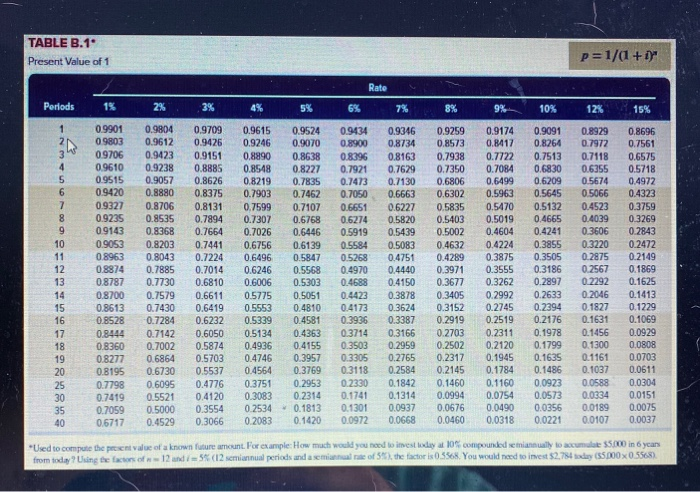
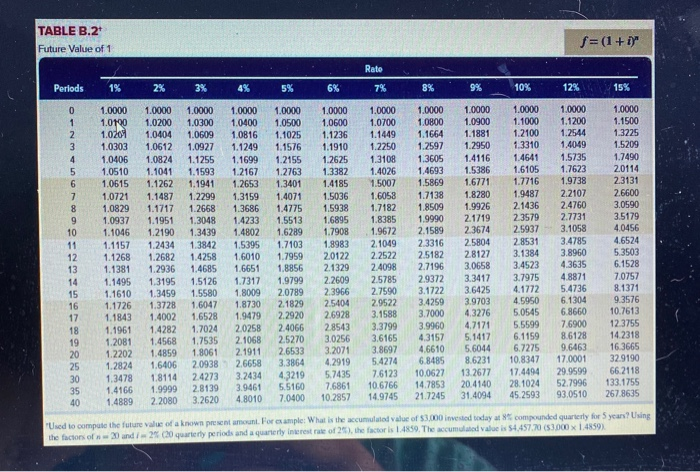
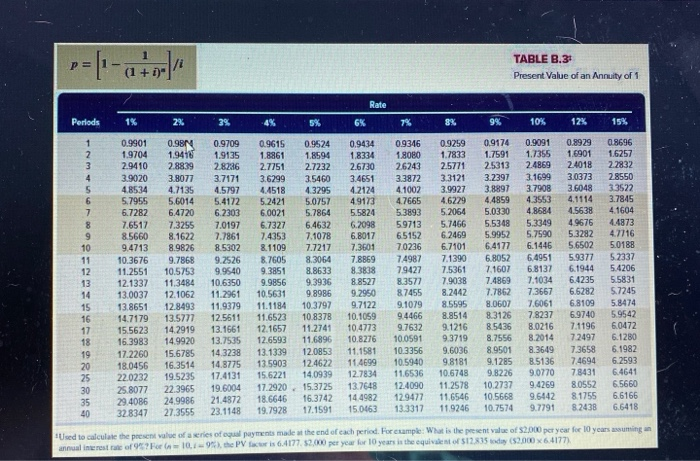
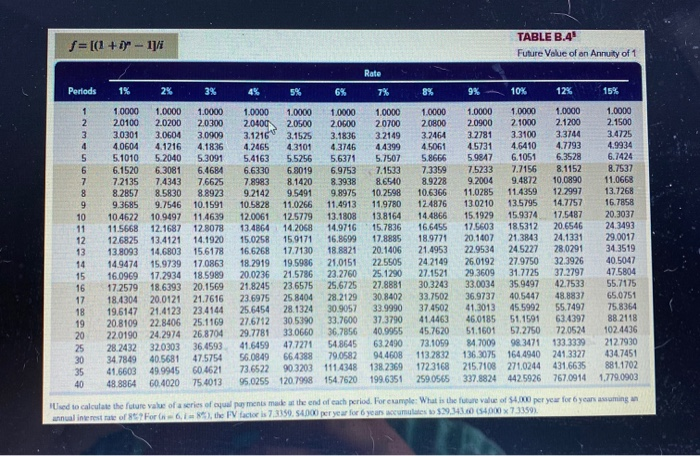
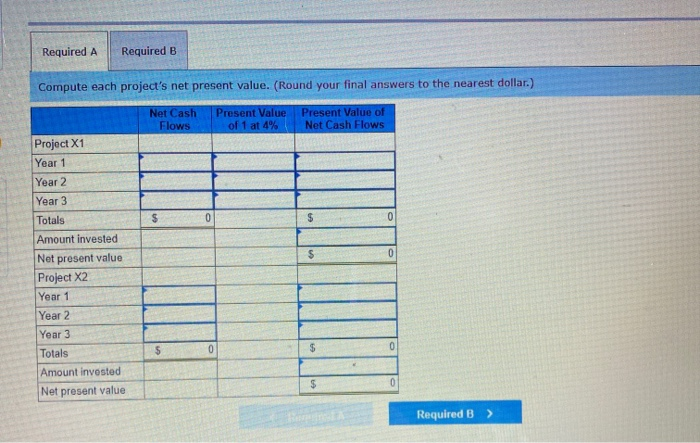
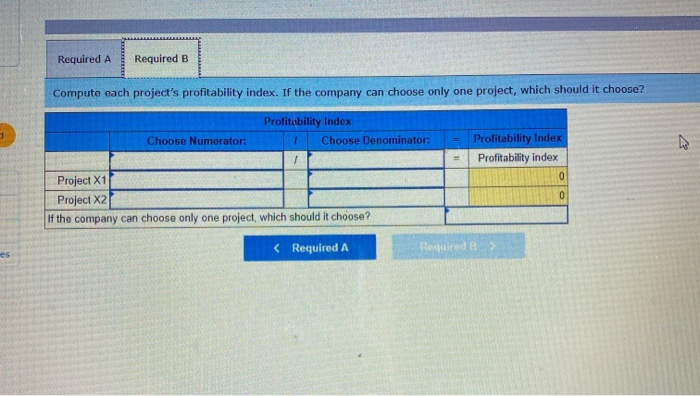
CH Exercise 11-11 Net present value, profitability index LO P3 Following is information on two alternative investments being considered by Tiger Co. The company requires a 4% return from its investments. (PV of $1. FV of $1. PVA of $1. and FVA of $1) (Use appropriate factor(s) from the tables provided.) Project x1 $(130,000) Project X2 $(220,000) Initial investment Expected net cash flows in: Year 1 Year 2 Year 3 50,000 60,500 85,500 97,500 87,500 77,500 a. Compute each project's net present value. b. Compute each project's profitability index. If the company can choose only one project, which should it choose? Complete this question by entering your answers in the tabs below. Required A Required B Compute each project's net present value. (Round your final answers to the nearest dollar) Net Cash Present Value Present Value of Flows of 1 at 4% Net Cash Flows TABLE B.1. Present Value of 1 p=1/(1+1) Rate Periods 1% 2% 3% 4% 5% 7% 9% 10% 12% 15% 1 22 3 4 5 6 7 8 9 10 11 12 13 0.9901 09803 09706 0.9610 0.9515 0.9420 0.9327 0.9235 0.9143 0.9053 0.8963 0.8874 0.8787 0.8700 0.8613 0.8528 0.8444 0.8360 0.8277 0.8195 0.7798 0.7419 0.7059 0.6717 0.9804 0.9612 0.9423 0.9238 0.9057 0.8880 0.8706 0.8535 0.8368 0.8203 0.8043 0.7885 0.7730 0.7579 0.7430 0.7284 0.7142 0.7002 0.6864 0.6730 0.6095 0.5521 0.5000 0.4529 0.9709 0.9426 0.9151 0.8885 0.8626 0.8375 0.8131 0.7894 0.7664 0.7441 0.7224 0.7014 0.6810 0.6611 0.6419 0.6232 0.6050 0.5874 0.5703 0.5537 0.4776 0.4120 0.3554 0.3066 0.9615 0.9246 0.8890 0.8548 0.8219 0.7903 0.7599 0.7307 0.7026 0.6756 0.6496 0.6246 0.6006 0.5775 0.5553 0.5339 0.5134 0.4936 0.4746 0.4564 0.3751 0.3083 0.2534 0.2083 0.9524 0.9070 0.8638 0.8227 0.7835 0.7462 0.7107 0.6768 0.6446 0.6139 0.5847 0.5568 0.5303 0.5051 0.4810 0.4581 0.4363 0.4155 0.3957 0.3769 0.2953 0.2314 0.1813 0.1420 0.9434 0.8900 0.8396 0.7921 0.7473 0.7050 0.6651 0.6274 0.5919 0.5584 0.5268 0.4970 0.4688 0.4423 0.4173 0.3936 0.3714 0.3503 0.3305 0.3118 0.2330 0.1741 0.1301 0.0972 0.9346 0.8734 0.8163 0.7629 0.7130 0.6663 0.6227 0.5820 0.5439 0.5083 0.4751 0.4440 0.4150 0.3878 0.3624 0.3387 0.3166 0.2959 0.2765 0.2584 0.1842 0.1314 0.0937 0.0668 0.9259 0.8573 0.7938 0.7350 0.6806 0.6302 0.5835 0.5403 0.5002 0.4632 0.4289 0.3971 0.3677 0.3405 0.3152 0.2919 0.2703 0.2502 0.2317 0.2145 0.1460 0.0994 0.0676 0.0460 0.9174 0.8417 0.7722 0.7084 0.6499 0.5963 0.5470 0.5019 0.4604 0.4224 0.3875 0.3555 0.3262 0.2992 0.2745 0.2519 0.2311 0.2120 0.1945 0.1784 0.1160 0.0754 0.0490 0.0318 0.9091 0.8264 0.7513 0.6830 0.6209 0.5645 0.5132 0.4665 241 0.3855 0.3505 0.3186 0.2897 0.2633 0.2394 0.2176 0.1978 0.1799 0.1635 0.1486 0.0923 0.0573 0.0356 0.0221 0.8929 0.7972 0.7118 0.6355 0.5674 0.5066 0.4523 0.4039 0.3606 0.3220 0.2875 0.2567 0.2292 0.2046 0.1827 0.1631 0.1456 0.1300 0.1161 0.1037 0.0588 0.0334 0.0189 0.0107 0.8696 0.7561 0.6575 0.5718 0.4972 0.4323 0.3759 0.3269 0.284 0.2472 0.2149 0.1869 0.1625 0.1413 0.1229 0.1069 0.0929 0.0808 0.0703 0.0611 0.0304 0.0151 0.0075 0.0037 15 16 17 18 19 20 25 30 35 40 *Used to compute the price value of a known future amcant. For example: How much would you need to investoday at 10% compounded semanal to cum 5.000 in 6 years from today? Using the factors of 12 and 5% (12 manual periods and seminare of the factor is 0.5568. You would need to invest $2.784 aday (55.000X05568) TABLE B.2 Future Value of 1 f=(1+1) Rato Periods 1% 2% 3% 5% 6% 7% 9% 10% 12% 15% 0 1 2 3 4 6 7 8 9 10 11 12 13 14 15 16 17 18 19 20 25 30 35 40 1.0000 1.0190 1.0201 1.0303 1.0406 1.0510 1.0615 1.0721 1.0829 1.0937 1.1046 1.1157 1.1268 1.1381 1.1495 1.1610 1.1726 1.1843 1.1961 1.2081 1.2202 1.2824 1.3478 1.4166 1.4889 1.0000 1.0200 1.0404 1.0612 1.0824 1.1041 1.1262 1.1487 1.1717 1.1951 1.2190 1.2434 1.2682 1.2936 1.3195 1.3459 1.3728 1.4002 1.4282 1.4568 1.4859 1.6406 1.8114 1.9999 2.2080 1.0000 1.0000 1.0300 1.0400 1.0609 1.0816 1.0927 1.1249 1.1255 1.1699 1.1593 1.2167 1.1941 1.2653 1.2299 1.3159 1.2668 1.3686 1.3048 1.4233 1.3439 1.4802 1.3842 1.5395 1.4258 1.6010 1,4685 1.6651 1.5126 1.7317 1.5580 1.8009 1.6047 1.8730 1.6528 1.9479 1.7024 2.0258 1.7535 2.1068 1.8061 2. 1911 2.0938 2.6658 2.4273 3.2434 2.8139 3.9461 3.2620 4.8010 1.0000 1.0500 1.1025 1.1576 1.2155 1.2763 1.3401 1.4071 1.4775 1.5513 1.6289 1.7103 1.7959 1.8856 1.9799 2.0789 2.1829 2.2920 2.4066 2.5270 2.6533 3.3864 4.3219 5.5160 7.0400 1.0000 1.0600 1.1236 1.1910 1.2625 1.3382 1.4185 1.5036 1.5938 1.6895 1.7908 1.8983 20122 2.1329 2.2609 2.3966 2.5404 2.6928 28543 3,0256 3.2071 4.2919 5.7435 7.6861 10.2857 1.0000 1.0700 1.1449 1.2250 1.3108 1.4026 1.5007 1.6058 1.7182 1.8385 1.9672 2.1049 2.2522 2.4098 25785 2.7590 2.9522 3.1588 3.3799 3.6165 3.8697 5.4274 7.6123 10.6766 14.9745 1.0000 1.0800 1.1664 1.2597 1.3605 1.4693 1.5869 1.7138 1.8509 1.9990 2.1589 2.3316 2.5182 2.7196 2.9372 3.1722 3.4259 3.7000 3.9960 4.3157 4.6610 6.8485 10.0627 14.7853 21.7245 1.0000 1.0900 1.1881 1.2950 1.4116 1.5386 1.6771 1.8280 1.9926 2.1719 2.3674 2.5804 2.8127 3.0658 3.3417 3.6425 3.9703 4.3276 4.7171 5.1417 5.6044 8.6231 13.2677 20.4140 31.4094 1.0000 1.1000 1.2100 1.3310 1.4641 1.6105 1.7716 1.9487 2.1436 2.3579 2.5937 28531 3.1384 3.4523 3.7975 4.1772 4.5950 5.0545 5.5599 6.1159 6.7275 10.8347 17.4494 28.1024 45.2593 1.0000 1.1200 1.2544 1.4049 1.5735 1.7623 1.9738 2.2107 2.4760 2.7731 3.1058 3.4785 3.8960 4.3635 4.8871 5.4736 6.1304 6.8660 7,6900 8.6128 9.6463 17.0001 29.9599 52.7996 93.0510 1.0000 1.1500 1.3225 1.5209 1.7490 20114 2.3131 2.6600 3.0590 3.5179 4.0456 4.6524 5.3503 6.1528 7.0757 8.1371 9.3576 10.7613 12 3755 14.2318 16.3665 32.9190 66.2118 133.1755 267.8635 Used to compute the future value of a known presentamount. For example: What is the accumulated value of $3.000 invested today at compounded quarterly for 5 years? Using the factors of and I 2 (20 quarterly periods and a quarterly interest rate of 25).the factor is 14850. The accumulated value is 54,457.70652000 x 1.4859) P=[1-a+o (1 + i)" TABLE B.31 Present Value of an Annuity of 1 Rate Periods 1% 2% 3% -4% 5% 6% 7% % 9% 10% 12% 15% 1 2 3 4 5 6 7 8 9 10 11 12 13 14 15 16 17 18 19 20 25 30 35 40 0.9901 1.9704 2.9410 39020 4.8534 5.7955 6.7282 7.6517 8.5660 9.4713 10.3676 11.2551 12.1337 13.0037 13.8651 14.7179 15.5623 16.3983 17.2260 18.0456 22.0232 25.8077 29.4086 32.8347 0.987 1.9410 2.8839 3.8077 4.7135 5.6014 6.4720 7.3255 8.1622 8.9826 9.7868 10.5753 11.3484 12.1062 12.8493 13.5777 14.2919 14.9920 15.6785 16.3514 19.5235 22.3965 24.9986 27.3555 0.9709 1.9135 2.8286 3.7171 4.5797 5.4172 6.2303 7.0197 7.7861 8.5302 9.2526 9.9540 10.6350 11.2961 11.9379 12.5611 13.1661 13.7535 14.3238 14.8775 17.4131 19.6004 21.4872 23. 1148 0.9615 0.9524 1.8861 1.8594 2.7751 2.7232 3.6299 3.5460 4.4518 4.3295 5.2421 5.0757 6.0021 5.7864 6.7327 6.4632 7.4353 7.1078 8.1109 7.7217 8.7605 8.3064 9.3851 8.8633 9.9856 9.3936 10.5631 9.8986 11.1184 10.3797 11.6523 10.8378 12.1657 11.2741 12.6593 11,6896 13.1339 12.0853 13.5903 12.4622 15.6221 14.0939 17.2920. 15.3725 18.6646 16.3742 19.7928 17.1591 0.9434 1.8334 2.6730 3.4651 4.2124 4.9173 5.5824 6.2098 6.8017 7.3601 7.8869 8.3838 8.8527 9.2950 9.7122 10.1059 10.4773 10.8276 11.1581 114699 12.7834 13.7648 14 4982 15.0463 0.9346 1.8080 26243 3.3872 4.1002 4.7665 5.3893 59713 65152 7.0236 7.4987 79427 8.3577 87455 9.1079 9.4466 9.7632 10.0591 10.3356 10.5940 11.6536 12.4090 129477 13.3317 0.9259 1.7833 2.5771 3.3121 3.9927 4.6229 5.2064 5.7466 6.2469 6.7101 7.1390 7.5361 7.9038 8.2442 8.5595 8.8514 9.1216 9.3719 9.6036 9.8181 10.6748 11.2578 11.6546 11.9246 0.9174 1.7591 2.5313 3.2397 3.8897 44859 5.0330 5.5348 5.9952 6.4177 6.8052 7.1607 7.4869 7.7862 8.0607 8.3126 8.5436 8.7556 8.9501 9.1285 9.8226 10.2737 10.5668 10.7574 0.9091 1.7355 2.4869 3.1699 3.7908 4.3553 4.8684 5.3349 5.7590 6.1446 6.4951 6.8137 7.1034 7.3667 7.6061 7.8237 8.0216 8.2014 8.3649 8.5136 9.0770 9.4269 9.6442 9.7791 0.8929 1.6901 2.4018 3.0373 3.6048 4,1114 4.5638 4.9676 5.3282 5,6502 5.9377 6.1944 6.4235 6.6282 6.8109 6.9740 7.1196 7.2497 7.3658 7.4694 7.8431 80552 81755 8.2438 0.8696 1.6257 2.2832 28550 3.3522 3.7845 4.1604 4.4873 4.7716 5.0188 5.7337 5.4206 5.5831 57245 5.8474 5.9542 6.0472 6.1280 6.1982 6.2593 6.4641 6.5660 6.6166 6.6418 Used to calculate the present value of a series of equal payments made at the end of each period. For example: What is the present value of 2.000 per year for 10 years assuming an annual interest rate of 95 - 10.19. the Pacis 6.4177.52,000 per year for 10 years is the equivalent of 512x35 today (52.000 X 6.4177) 1 7 TABLE B.4 f=[(1 + i)" - 1] Future Value of an Annuity of 1 Rate Periods 1% 2% 3% 5% 6% 7% 8% 9% 10% 12% 15% 1.0000 1.0000 1.0000 1.0000 1.0000 1.0000 1.0000 1.0000 1.0000 1.0000 1.0000 1.0000 2 20100 2.0200 2.0300 20400 20500 2.0600 20700 20800 2.0900 21000 2.1200 2.1500 3 30301 3.0604 3.0909 3.1216 3.1525 3.1836 3.2149 3.2464 3.2781 3.3100 3.3744 3.4725 4 4.0604 4.1216 4.1836 4.2465 4.3101 4.3746 44399 4.5061 4.5731 4.6410 4.7793 4.9934 S 5.1010 5.2040 5.3091 5.4163 5.5256 5.6371 5.7507 5.8666 5.9817 6.1051 6.3528 6.7424 6 6.1520 6.3081 6.4684 6.6330 6.8019 6.9753 7.1533 7.3359 7.5233 7.7156 8.1152 8.7537 7.2135 7.4343 7.6625 7.8983 8.1420 8.3938 8.6540 8.9228 9.2004 9.4872 10.0890 11.0668 8 8.2857 8.5830 8.8923 9.2142 9.5491 9.8975 10.2598 10.6366 11.0285 11.4359 12.2997 13.7268 9 9.3685 9.7546 10.1591 10.5828 11.0266 11.4913 11.9780 124876 130210 13.5795 14.7757 16.7858 10 10.4622 10.9497 11.4639 12.0061 12.5779 13.1808 13.8164 14.4866 15.1929 15.9374 17.5487 20.3037 11 11.5668 12.1687 12.8078 13.4864 14.2068 14.9716 15.7836 16.6455 17.5603 18.5312 20.6546 24.3493 12 12.6825 13.4121 14.1920 15.0258 15.9171 16,8699 17.8885 18.9771 20.1007 21.3843 24.1331 29.0017 13 13.8093 14.6803 15.6178 16.6268 17.7130 18.8821 20.1406 21.4953 22.9534 24.5227 28.0291 34.3519 14 14.9474 15.9739 17.0863 18.2919 19.5986 21.0151 22.5505 24 2149 26.0192 27.9750 32.3926 40.5047 15 16.0969 17.2934 18.5989 20.0236 21.5786 23.2760 25.1290 27.1521 29 3609 31.7725 37.2797 47.5804 16 17.2579 18.6393 20.1569 21.8245 23.6575 25.6725 27.8881 30.3243 33.0034 35.9497 42.7533 55.7175 17 18.4304 20.0121 21.7616 23.6975 25.8404 28.2129 30.8402 33.7502 36.9737 40.5447 48.8837 65.0751 18 19.6147 21.4123 23.4144 25.6454 28.1324 30.9057 33.9990 37.4502 41.3013 45.5992 55.7497 75.8364 19 20.8109 22.8406 25.1169 27.6712 30.5390 33.7600 37.3790 41.4463 46.0185 51.1591 63.4397 88 2118 20 22.0190 24.2974 26.8704 29.7781 33.0660 36.7856 40.9955 45.7620 51.1601 57.2750 72.0524 1024436 25 28.2432 32.0303 36.4593 41.6459 47.7271 54.8645 63.2490 73.1059 84.7009 98.3471 133.3339 212.7930 30 347849 40.5681 47.5754 56.0849 66.4388 79.0582 94.4608 113.2832 136,3075 164 4940 241,3327 434.7451 35 41.6603 49.994560.4621 73.6522 90.3203 1114348 138.2369 1723168 215.7108 271.0244 431,6635 881.1702 40 48.8864 60.4020 75.4013 95,02551207998 154.7620 199.6351 259.0565 337.8824 442.5926 767.0914 1.779.0903 Used to calculate the future value of a series of payments made at the end of each period. For cumple: What is the future value of $4.000 per year for 6 years assuming an annual interest rate of 85 For the FV factor is 7.3350, 54000 per year for your accumulates $29.345.0 54000 x 733591 Required A Required B Compute each project's net present value. (Round your final answers to the nearest dollar.) Net Cash Flows Present Value of 1 at 4% Present Value of Net Cash Flows $ 0 $ 0 $ 0 Project X1 Year 1 Year 2 Year 3 Totals Amount invested Net present value Project X2 Year 1 Year 2 Year 3 Totals Amount invested Net present value $ 0 $ 0 $ 0 Required B > Required A Required B Compute each project's profitability index. If the company can choose only one project, which should it choose? Profitability Index Choose Denominator: Choose Numerator: 7 Profitability Index Profitability index 0 0 Project X1 Project X2 If the company can choose only one project, which should it choose?
Step by Step Solution
There are 3 Steps involved in it

Get step-by-step solutions from verified subject matter experts