

Question: ch The table below contains data on Fincorp Inc. The balance sheet items correspond to values at year-end 2015 and 2016, while the income statement
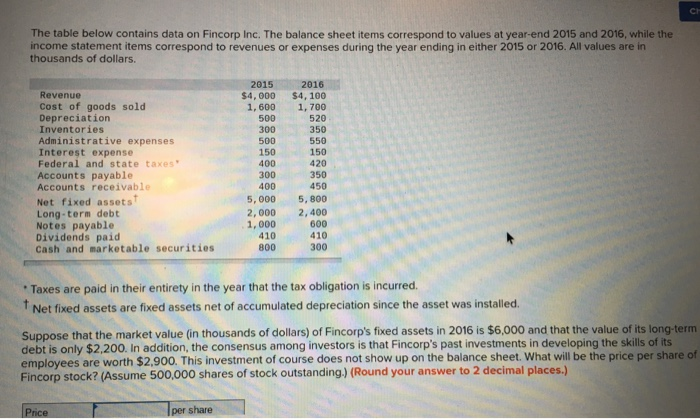
ch The table below contains data on Fincorp Inc. The balance sheet items correspond to values at year-end 2015 and 2016, while the income statement items correspond to revenues or expenses during the year ending in either 2015 or 2016. All values are in thousands of dollars 2016 $4, 000 $4, 100 1,600 1,700 2015 Revenue Cost of goods sold Depreciation Inventories Administrative expenses Interest expense Federal and state taxes Accounts payable Accounts receivable Net fixed assets Long-term debt Notes payable Dividends paid Cash and marketable securities 500350 550 500 300 150 400 300 150 420 00 350 5, 000 5, 800 2, 000 2,400 600 410 300 450 1, 000 410 800 Taxes are paid in their entirety in the year that the tax obligation is incurred f Net fixed assets are fixed assets net of accumulated depreciation since the asset was installed. Suppose that the market value (in thousands of dollars) of Fincorp's fixed assets in 2016 is $6,000 and that the value of its long-term debt is only $2,200. In addition, the consensus among investors is that Fincorp's past investments in developing the skills of its employees are worth $2,900. This investment of course does not show up on the balance sheet. What will be the price per share of Fincorp stock? (Assume 500,000 shares of stock outstanding) (Round your answer to 2 decimal places.) per share
Step by Step Solution
There are 3 Steps involved in it

Get step-by-step solutions from verified subject matter experts