

Question: Ch12 1. Using the data in the following table, estimate the average return and volatility for each stock. Realized Returns Year 2008 2009 2010 2011
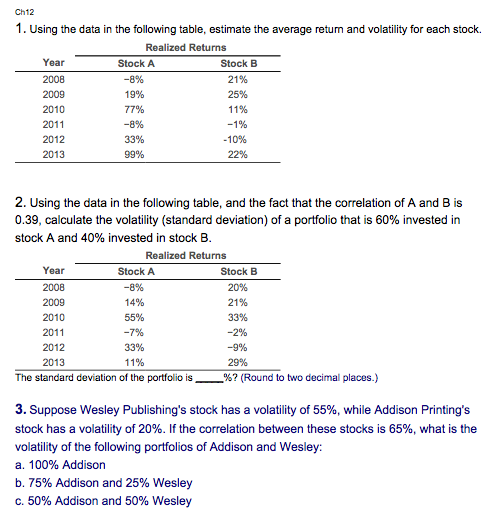
Ch12 1. Using the data in the following table, estimate the average return and volatility for each stock. Realized Returns Year 2008 2009 2010 2011 2012 2013 Stock A Stock B 21% 25% 11% 19% 33% 99% 10% 22% 2. Using the data in the following table, and the fact that the correlation of A and B is 0.39, calculate the volatility (standard deviation) of a portfolio that is 60% invested in stock A and 40% invested in stock B Realized Returns Year 2008 2009 2010 2011 2012 2013 Stock A Stock B 20% 21% 33% -2% 14% 55% 33% 11% 29% -%? (Round to two decimal places.) The standard deviation of the portfolio is 3. Suppose Wesley Publishing's stock has a volatility of 55%, while Addison Printing's stock has a volatility of 20%. If the correlation between these stocks is 65%, what is the volatility of the following portfolios of Addison and Wesley: a. 100% Addison b.75% Addison and 25% Wesley C. 50% Addison and 50% Wesley
Step by Step Solution
There are 3 Steps involved in it

Get step-by-step solutions from verified subject matter experts