

Question: (Ch12-prob set-Q5) please answer questions in the image. Note: 1-6 require computation to determine numerical values. Note: Answer selections for 8 : Product/sum/difference/or ratio (select
(Ch12-prob set-Q5) please answer questions in the image. Note: 1-6 require computation to determine numerical values. Note: Answer selections for "8" : Product/sum/difference/or ratio (select one). Note: Answer selections for "10" "11" & "12": close to 1/ close to 0/ or large
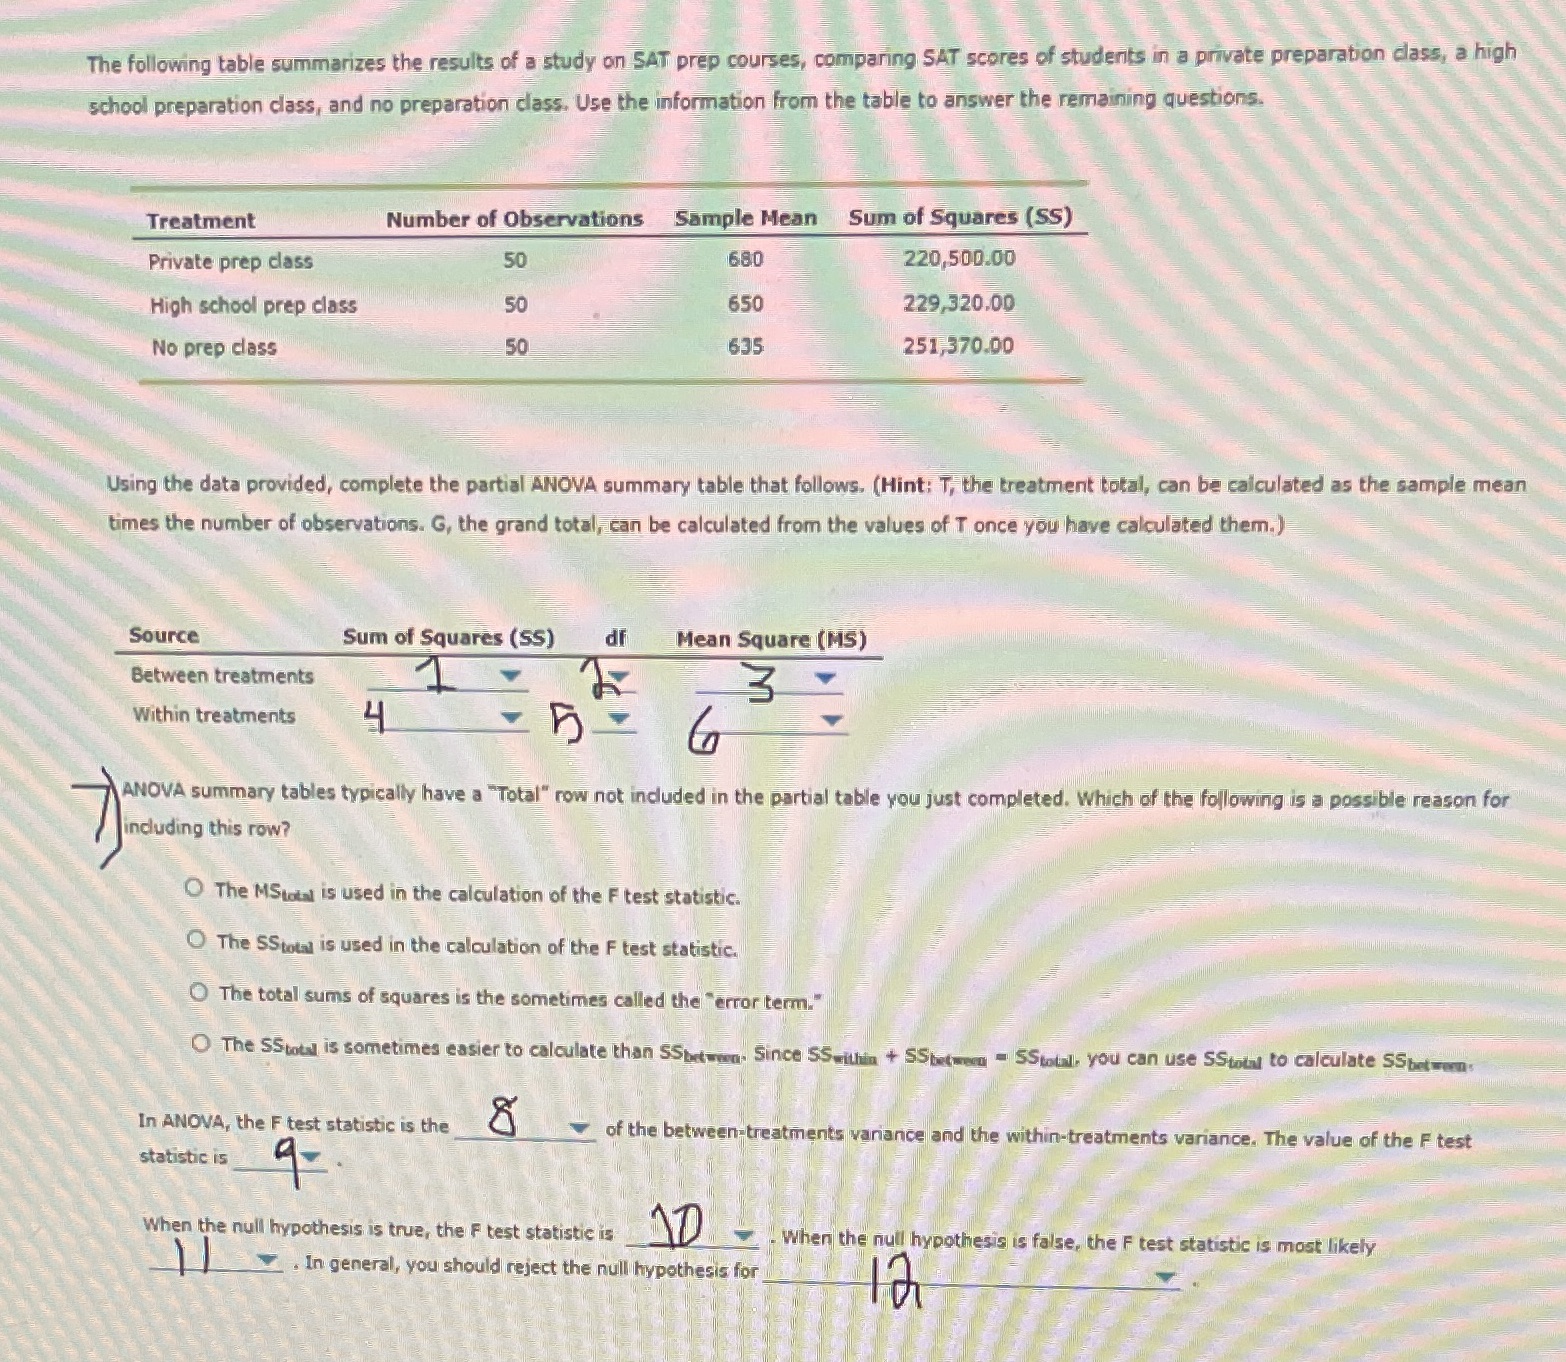
The following table summarizes the results of a study on SAT prep courses, comparing SAT scores of students in a private preparation class, a high school preparation class, and no preparation class. Use the information from the table to answer the remaining questions. Treatment Number of Observations Sample Mean Sum of Squares (SS) Private prep class 50 680 220,500.00 High school prep class 50 650 229,320.00 No prep class 50 635 251,370.00 Using the data provided, complete the partial ANOVA summary table that follows. (Hint: T, the treatment total, can be calculated as the sample mean times the number of observations. G, the grand total, can be calculated from the values of T once you have calculated them.) Source Sum of Squares (SS) df Mean Square (MS) Between treatments Within treatments 4 h ANOVA summary tables typically have a "Total" row not included in the partial table you just completed. Which of the following is a possible reason for including this row? The MStotal is used in the calculation of the F test statistic. The SStotal is used in the calculation of the F test statistic. The total sums of squares is the sometimes called the "error term." O The SStotal is sometimes easier to calculate than SSbtwwa. Since SSwilkin + SSbetween = SStotal you can use SStotal to calculate SSbet wam In ANOVA, the F test statistic is the 8 of the between-treatments variance and the within-treatments variance. The value of the F test statistic is 9 - When the null hypothesis is true, the F test statistic is AD . When the null hypothesis is false, the F test statistic is most likely . In general, you should reject the null hypothesis for
Step by Step Solution
There are 3 Steps involved in it

Get step-by-step solutions from verified subject matter experts