

Question: (Ch14-prob set-Q4) please answer all questions in the image. Please also complete the table by computing the missing data. Note: these are the 5 pairs
(Ch14-prob set-Q4) please answer all questions in the image. Please also complete the table by computing the missing data. Note: these are the 5 pairs of scores that are given: 6,1 / 9,2/ 6,3 / 8,4/ 1, 10 . Note: Answer selections for question A & B: negative/positive/zero Note: answer selections for question C: positiveegative/depends on the sign of SSx & SSyNote: answer selections for e&f : similar/different and correlation isn't the same as causation/the relationship between x & y is nonlinear/x and y are correlated/ (1,10) is an outlier
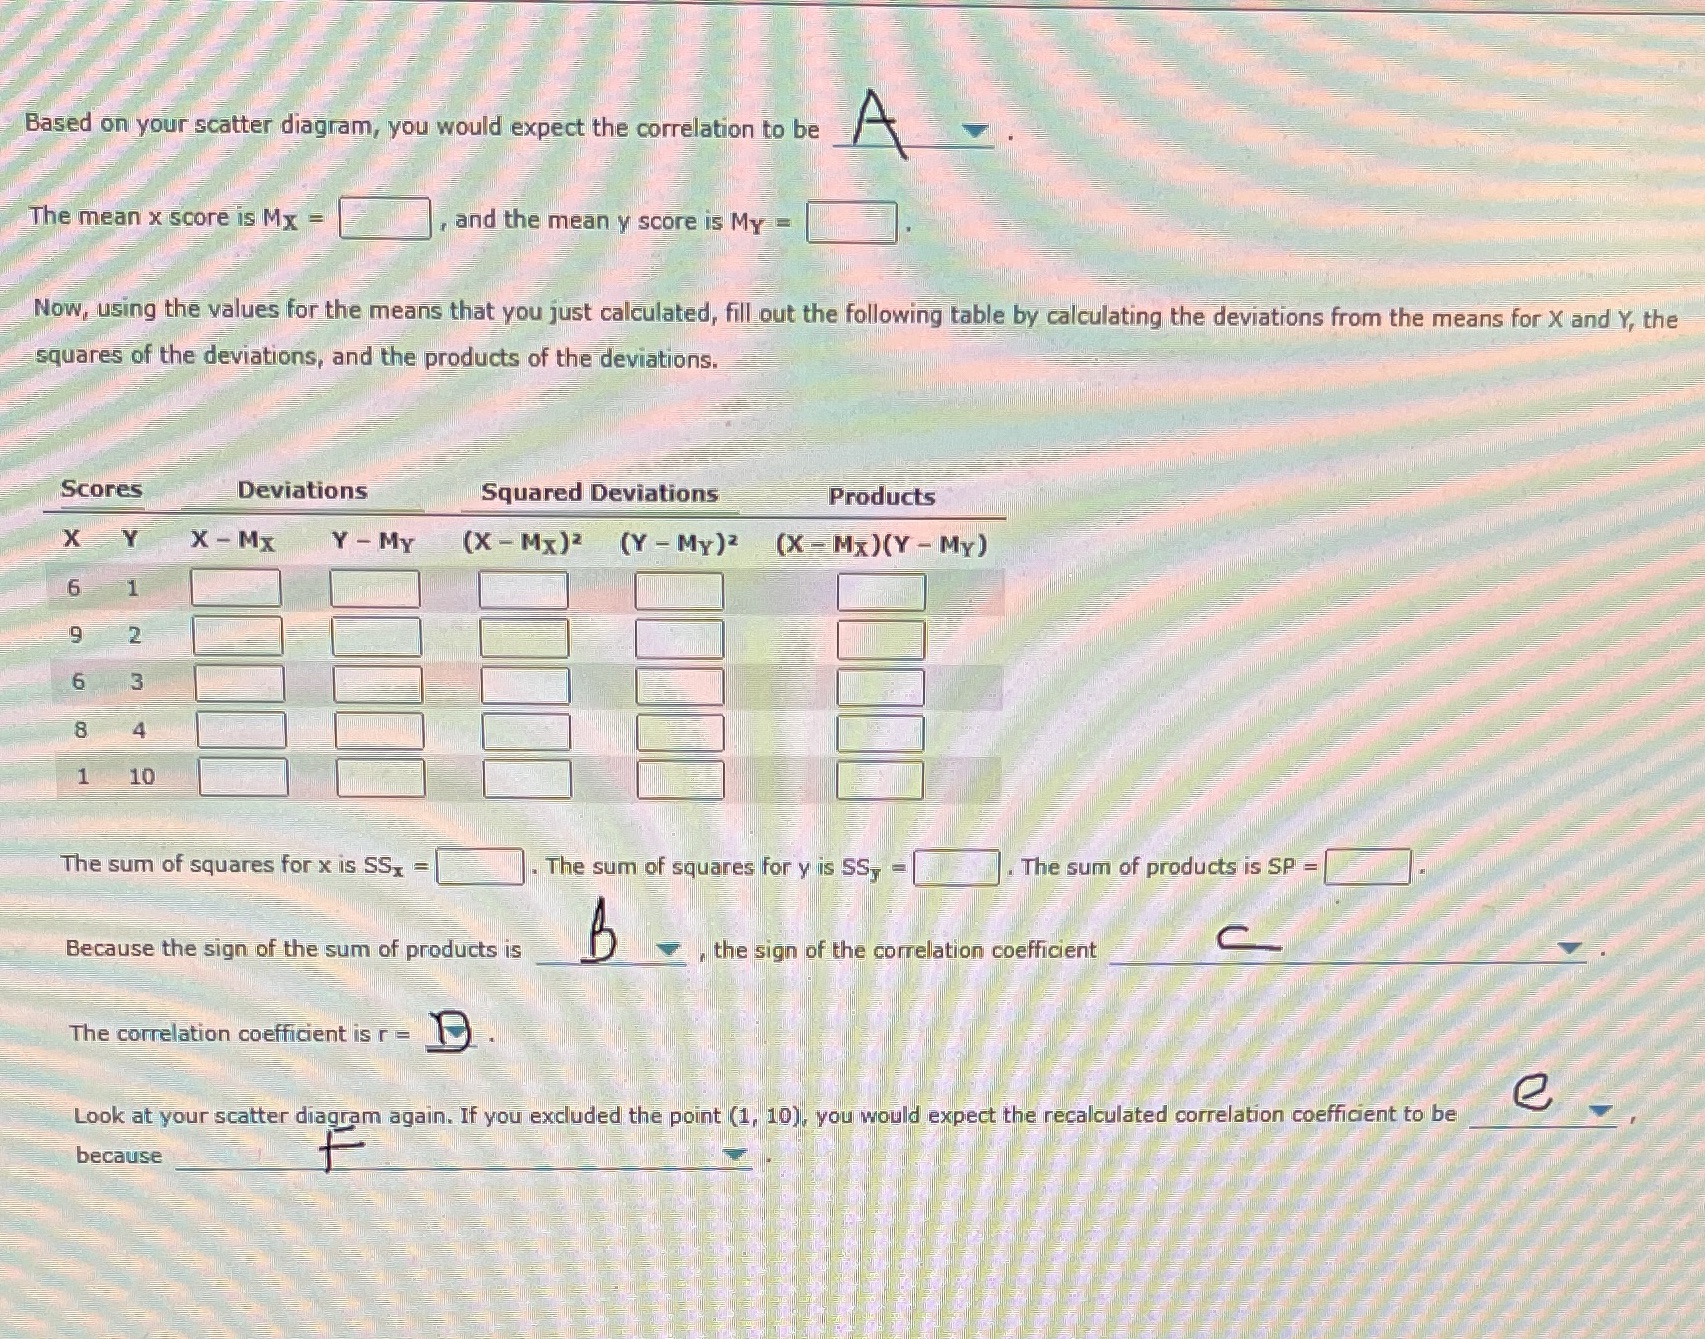
Based on your scatter diagram, you would expect the correlation to be A The mean x score is Mx = and the mean y score is My = Now, using the values for the means that you just calculated, fill out the following table by calculating the deviations from the means for X and Y, the squares of the deviations, and the products of the deviations. Scores Deviations Squared Deviations Products X Y X - Mx Y - MY (X - Mx)2 (Y -My)2 (X-Mx) (Y - MY) 6 8 1 10 The sum of squares for x is SS, = . The sum of squares for y is SS, = . The sum of products is SP Because the sign of the sum of products is B ,the sign of the correlation coefficient The correlation coefficient is r= e Look at your scatter diagram again. If you excluded the point (1, 10), you would expect the recalculated correlation coefficient to be because
Step by Step Solution
There are 3 Steps involved in it

Get step-by-step solutions from verified subject matter experts