

Question: (Ch14-prob set-Q6) please answer the question in the image by finding the numerical values that completes the chart. Note: the answer options for the 1st
(Ch14-prob set-Q6) please answer the question in the image by finding the numerical values that completes the chart. Note: the answer options for the 1st blue drop down is the following: 7/4/6.75/1 (indicate which option makes that statement true).
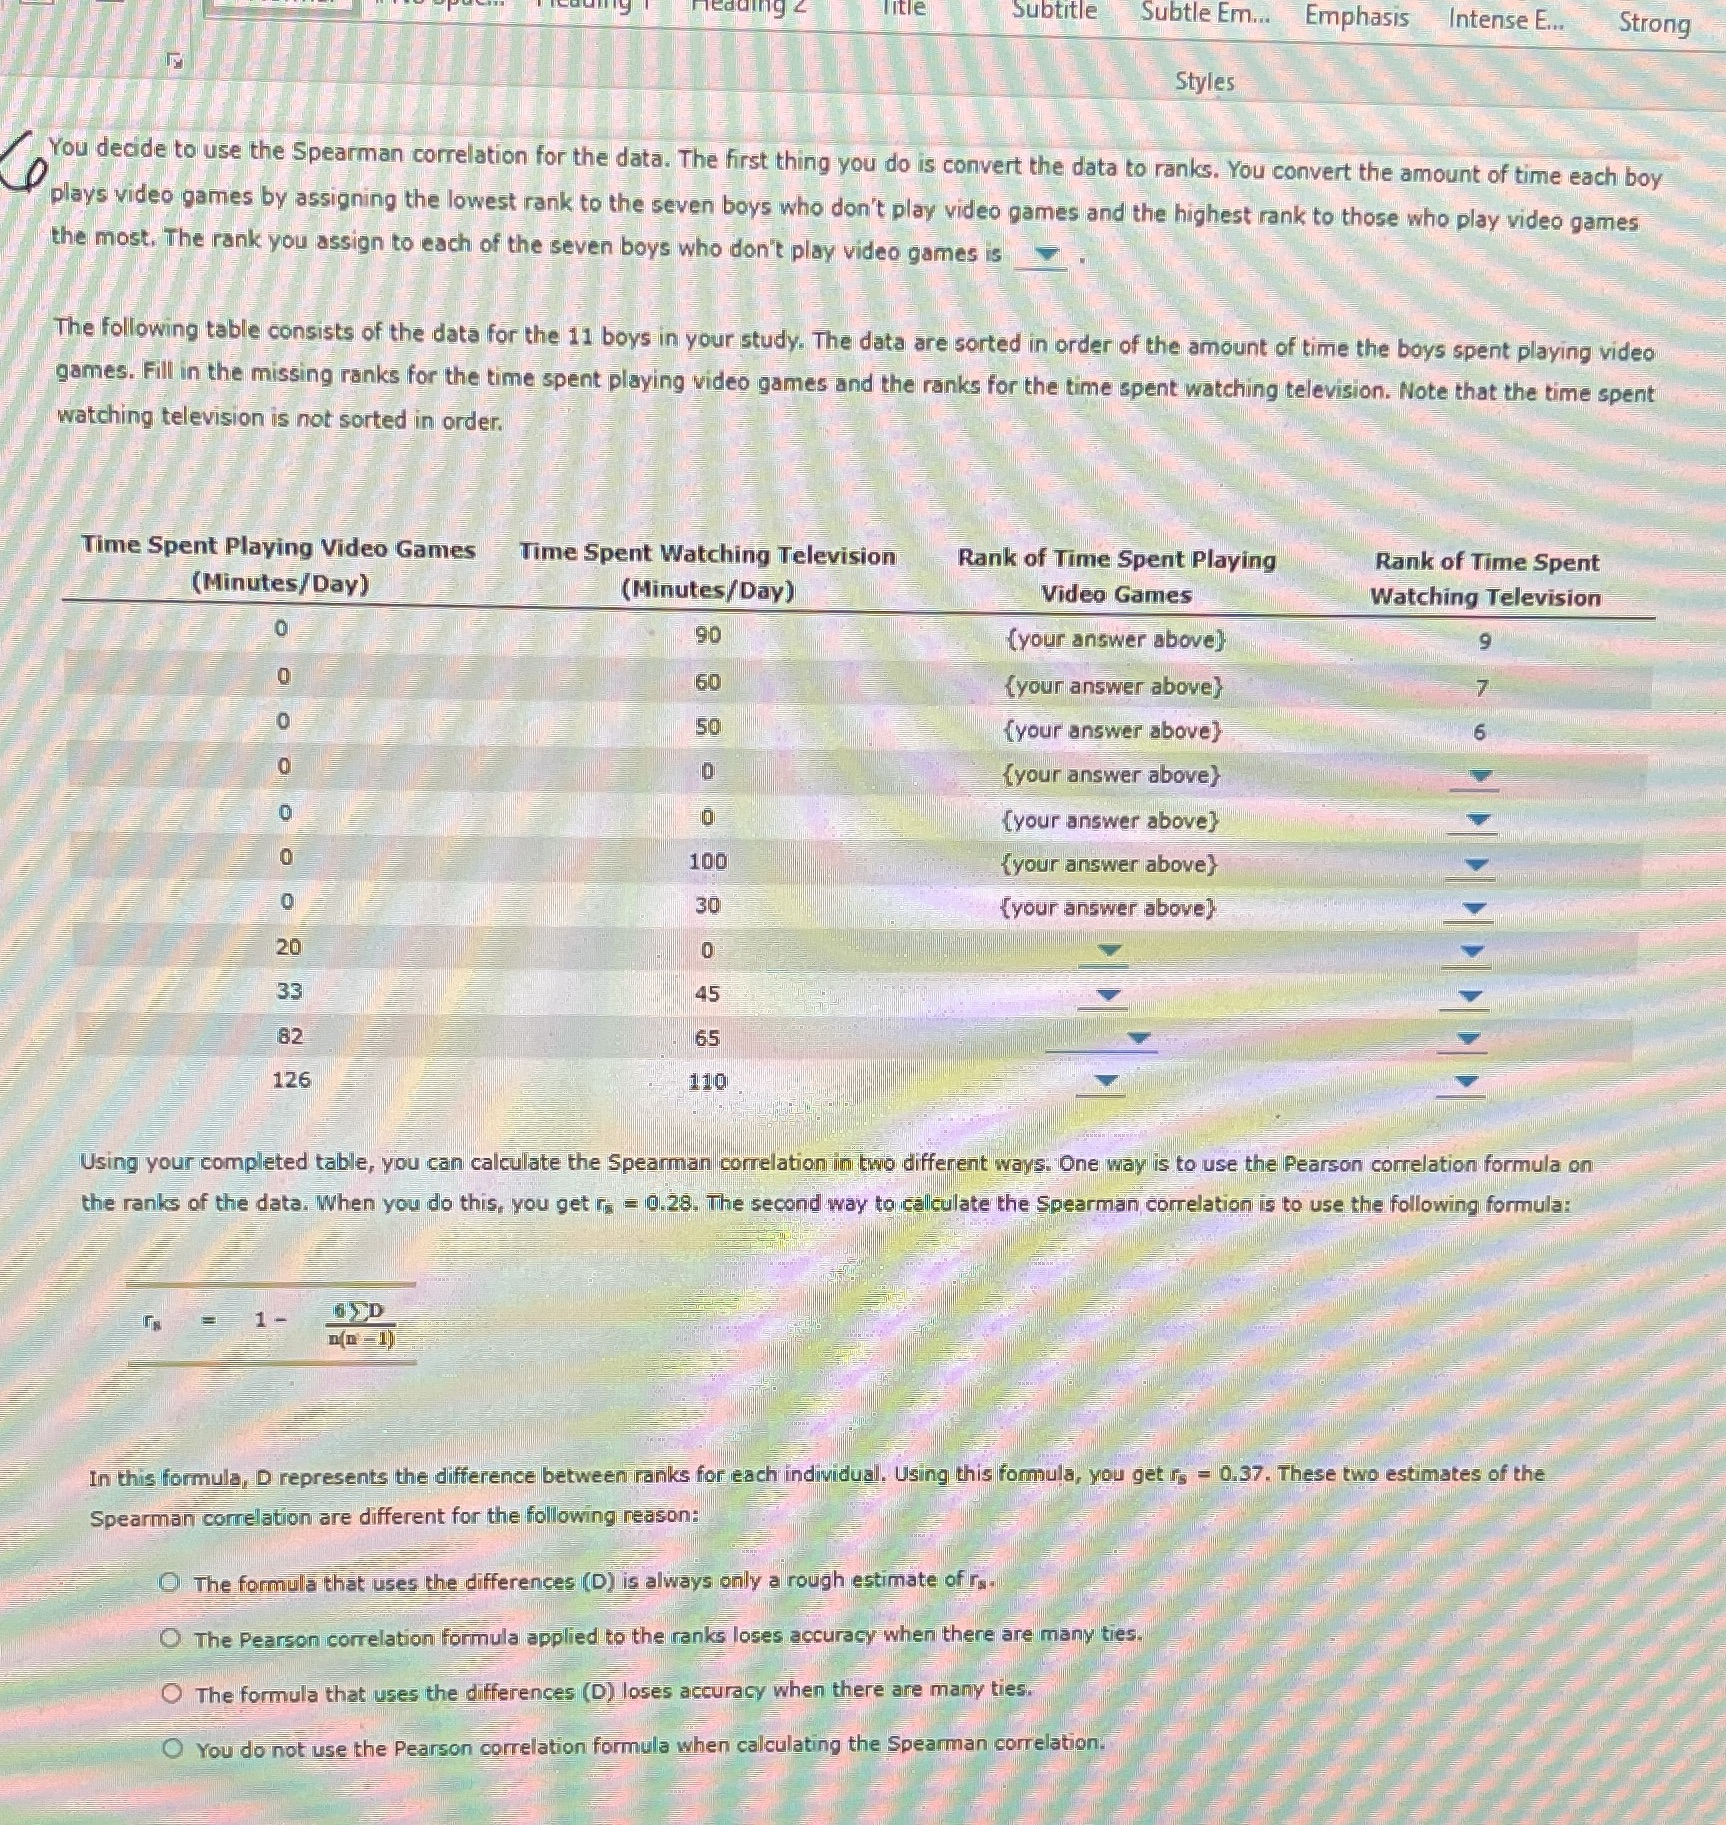
Subtitle Subtle Em. Emphasis Intense E.. Strong Styles You decide to use the Spearman correlation for the data. The first thing you do is convert the data to ranks. You convert the amount of time each boy plays video games by assigning the lowest rank to the seven boys who don't play video games and the highest rank to those who play video games the most. The rank you assign to each of the seven boys who don't play video games is The following table consists of the data for the 11 boys in your study. The data are sorted in order of the amount of time the boys spent playing video games. Fill in the missing ranks for the time spent playing video games and the ranks for the time spent watching television. Note that the time spent watching television is not sorted in order. Time Spent Playing Video Games Time Spent Watching Television Rank of Time Spent Playing Rank of Time Spent (Minutes/Day) (Minutes/ Day) Video Games Watching Television 90 (your answer above] (your answer above} 50 {your answer above) {your answer above) {your answer above} 100 {your answer above} 30 {your answer above} 0 33 45 82 65 126 110 Using your completed table, you can calculate the Spearman correlation in two different ways. One way is to use the Pearson correlation formula on the ranks of the data. When you do this, you get r. = 0.28. The second way to calculate the Spearman correlation is to use the following formula: GED In this formula, D represents the difference between ranks for each individual. Using this formula, you get is = 0.37. These two estimates of the Spearman correlation are different for the following reason: The formula that uses the differences (D) is always only a rough estimate of re- The Pearson correlation formula applied to the ranks loses accuracy when there are many ties. The formula that uses the differences (D) loses accuracy when there are many ties. You do not use the Pearson correlation formula when calculating the Spearman correlation
Step by Step Solution
There are 3 Steps involved in it

Get step-by-step solutions from verified subject matter experts