

Question: ch8 3. Measuring stand-alone risk using realized (historical) data Returns earned over a given time period are called realized returns. Historical data on realized returns
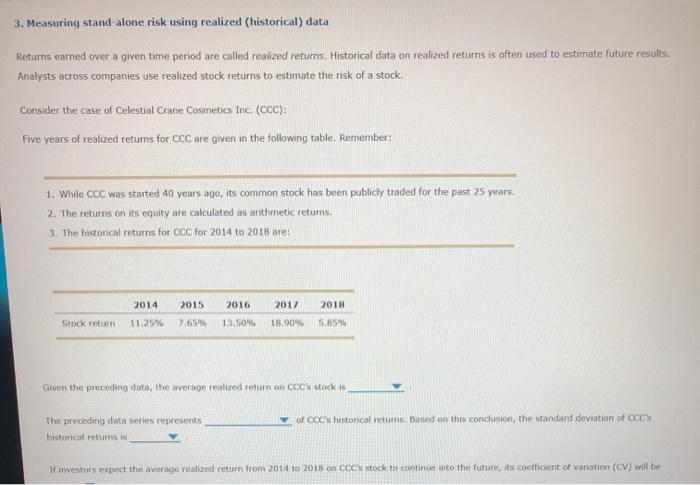
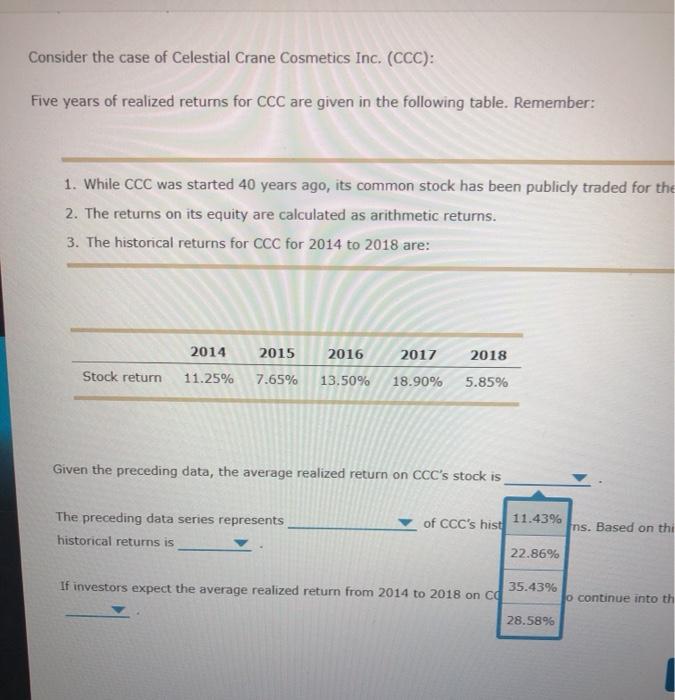
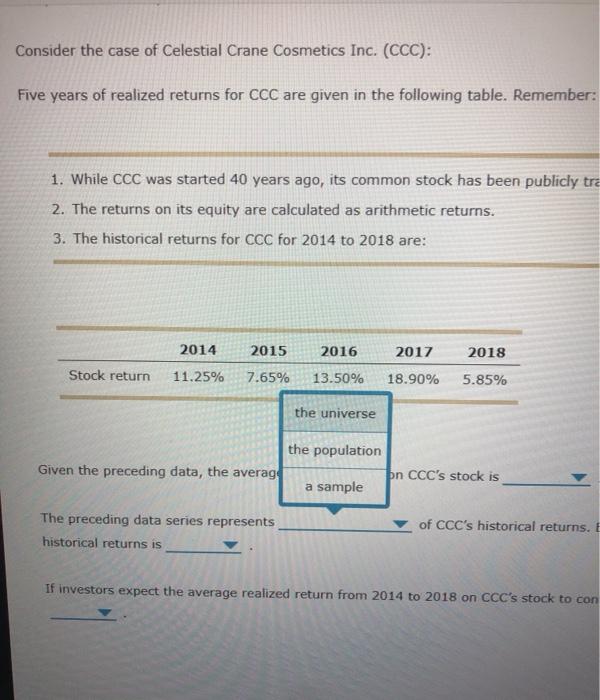
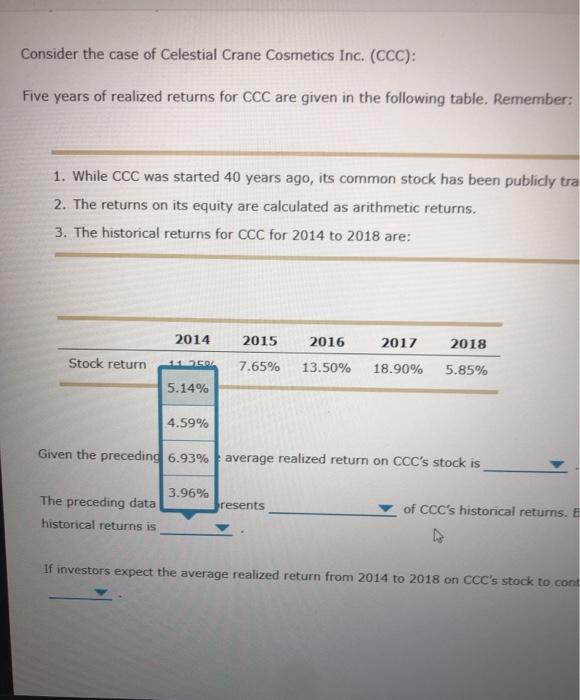
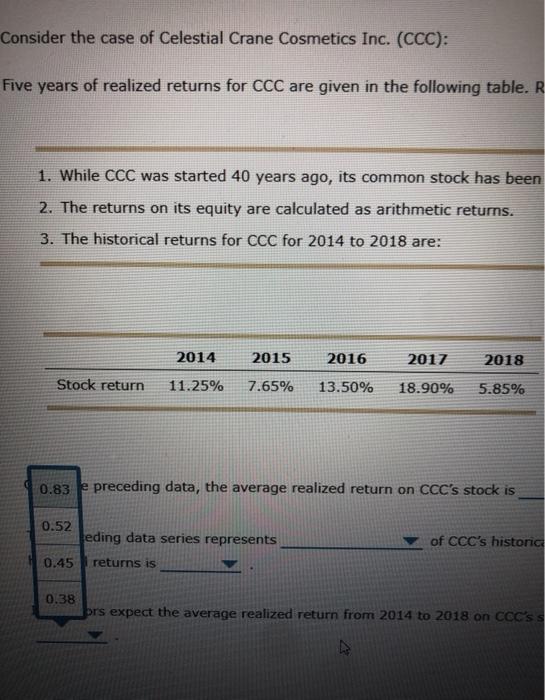
3. Measuring stand-alone risk using realized (historical) data Returns earned over a given time period are called realized returns. Historical data on realized returns is often used to estimate future results. Analysts across companies use realized stock returns to estimate the risk of a stock. Consider the case of Celestial Crane Cosmetics Inc. (CCC): Five years of realized returns for OCC are given in the following table. Remember: 1. While coc was started 40 years ago, its common stock has been publicly traded for the past 25 years. 2. The returns on its equity are calculated as arithmetic retums. 3. The historical returns for CC for 2014 to 2018 are: 2014 2015 7.65% 2016 13.50% 2017 18.00% 2018 5.65% Stock return 11.25% Given the preceding data, the average realized return on CCC socks The preceding data seties represents historical return is of cos historical returns. Based on this conclusion, the standard deviation of CCC's If inwestors expect the average realized return from 2014 to 2018 on CCS stock to continue into the future, its coeficient of vanation (V) will be Consider the case of Celestial Crane Cosmetics Inc. (CCC): Five years of realized returns for CCC are given in the following table. Remember: 1. While CCC was started 40 years ago, its common stock has been publicly traded for the 2. The returns on its equity are calculated as arithmetic returns. 3. The historical returns for CCC for 2014 to 2018 are: 2014 2015 2016 2017 2018 Stock return 11.25% 7.65% 13.50% 18.90% 5.85% Given the preceding data, the average realized return on CCC's stock is The preceding data series represents historical returns is of CCC's hist 11.43% ns. Based on thi 22.86% 35.43% If investors expect the average realized return from 2014 to 2018 on cd o continue into th 28.58% Consider the case of Celestial Crane Cosmetics Inc. (CCC): Five years of realized returns for CCC are given in the following table. Remember: 1. While CCC was started 40 years ago, its common stock has been publicly tra 2. The returns on its equity are calculated as arithmetic returns. 3. The historical returns for CCC for 2014 to 2018 are: 2014 2015 2016 2017 2018 Stock return 11.25% 7.65% 13.50% 18.90% 5.85% the universe Given the preceding data, the averag the population bn CCC's stock is a sample The preceding data series represents historical returns is of CCC's historical returns. E If investors expect the average realized return from 2014 to 2018 on CCC's stock to con Consider the case of Celestial Crane Cosmetics Inc. (CCC): Five years of realized returns for CCC are given in the following table. Remember: 1. While CCC was started 40 years ago, its common stock has been publicly tra 2. The returns on its equity are calculated as arithmetic returns. 3. The historical returns for CCC for 2014 to 2018 are: 2014 2015 2016 2017 2018 Stock return 250 7.65% 13.50% 18.90% 5.85% 5.14% 4.59% Given the preceding 6.93% average realized return on CCC's stock is 3.96% resents The preceding data historical returns is of CCC's historical returns. E If investors expect the average realized return from 2014 to 2018 on CCC's stock to cont Consider the case of Celestial Crane Cosmetics Inc. (CCC): Five years of realized returns for CCC are given in the following table. R 1. While CCC was started 40 years ago, its common stock has been 2. The returns on its equity are calculated as arithmetic returns. 3. The historical returns for CCC for 2014 to 2018 are: 2014 2015 2016 2017 2018 Stock return 11.25% 7.65% 13.50% 18.90% 5.85% 0.83 le preceding data, the average realized return on CCC's stock is 0.52 eding data series represents of CCC's historic 0.45 returns is 0.38 brs expect the average realized return from 2014 to 2018 on CCC'S
Step by Step Solution
There are 3 Steps involved in it

Get step-by-step solutions from verified subject matter experts