

Question: ch9 question q12 Can i have help with B. pleas OPS 1100 Tracey Gray & 11/25/21 10:52 PM M 21 12:00 Question 12, Problem 22
ch9 question q12 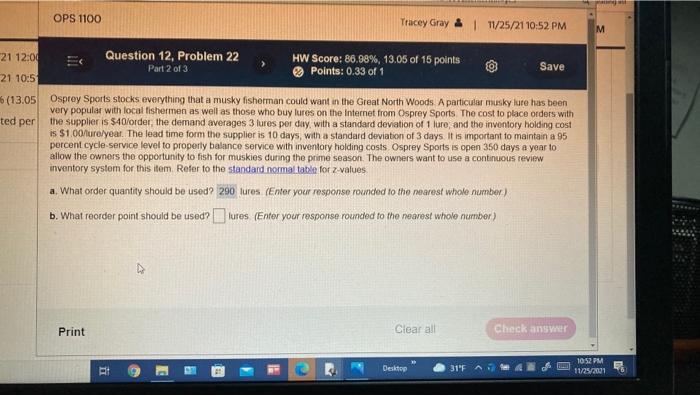
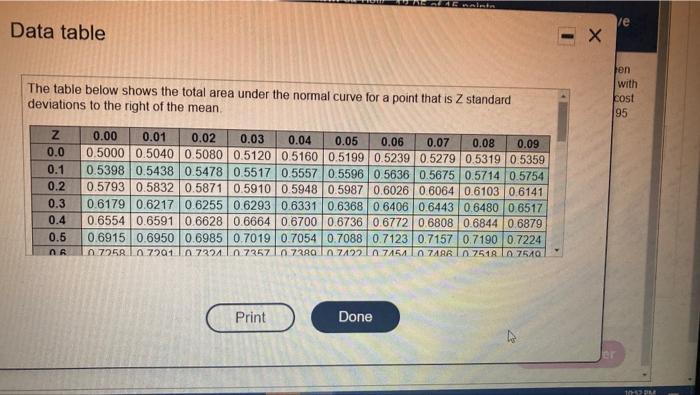
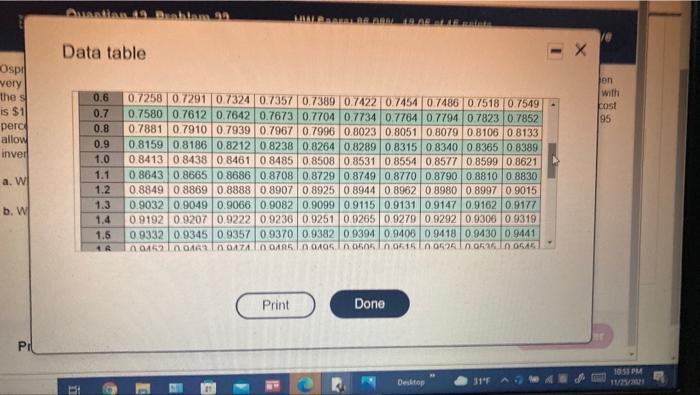
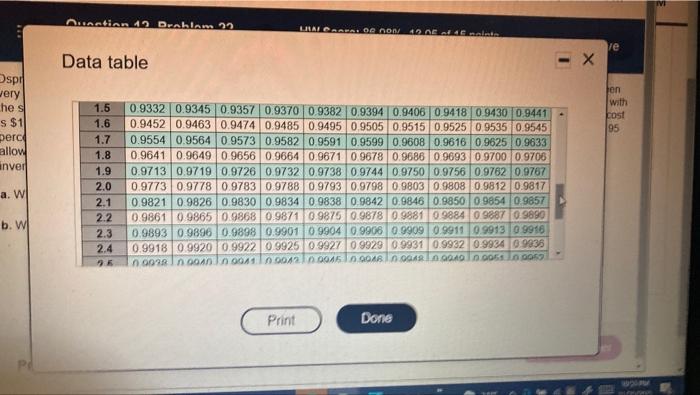
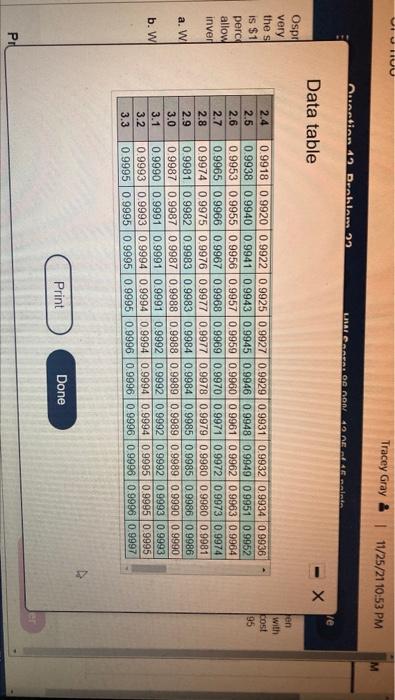
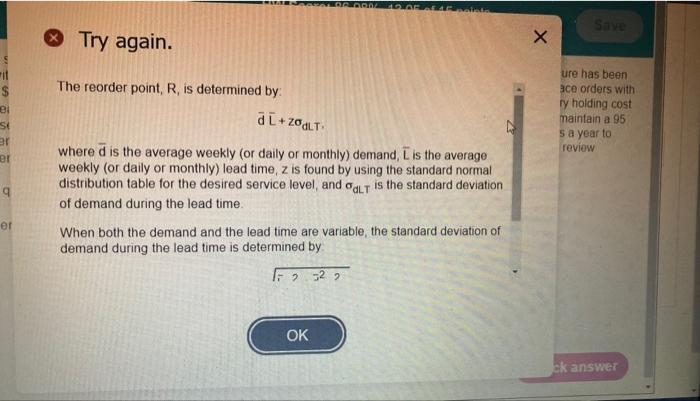
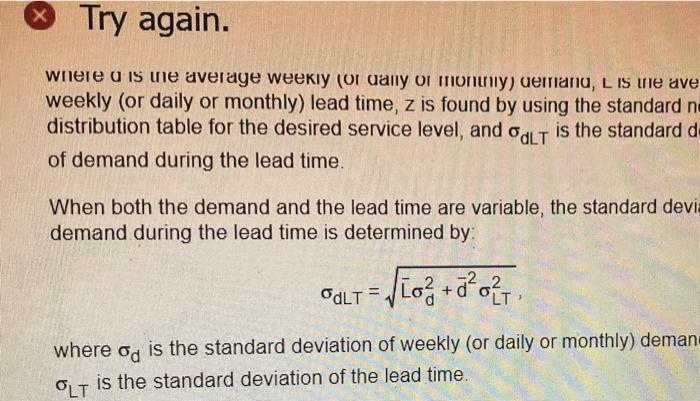
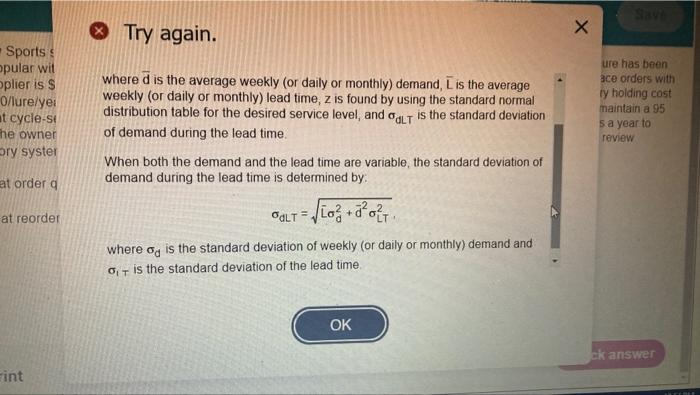
OPS 1100 Tracey Gray & 11/25/21 10:52 PM M 21 12:00 Question 12, Problem 22 Part 2 of 3 HW Score: 86.98%, 13.05 of 15 points Points: 0.33 of 1 Save 21 10:5 (13.05 ted per Osprey Sports stocks everything that a musky fisherman could want in the Great North Woods. A particular musky lure has been very popular with local fishermen as well as those who buy lures on the Internet from Osprey Sports The cost to place orders with the supplier is $40/order the demand averages 3 lures per day, with a standard deviation of 1 lure, and the inventory holding cost is $100/uro/year. The load time form the supplier is 10 days, with a standard deviation of 3 days. It is important to maintain a 95 percent cycle-service level to properly balance service with inventory holding costs Osprey Sports is open 350 days a year to allow the owners the opportunity to fish for muskies during the prime season. The owners want to use a continuous review inventory system for this item Refer to the standard normaltable for z values a. What order quantity should be used? 290 tures (Enter your response rounded to the nearest whole number) b. What reorder point should be used? lures (Enter your response rounded to the nearest whole number) Print Clear all Check ans Desktop E 31FA 1052 PM 11/25/2001 . ve Data table - X The table below shows the total area under the normal curve for a point that is Z standard deviations to the right of the mean en with cost 95 Z 0.0 0.1 0.2 0.3 0.4 0.5 AR 0.00 0.01 0.02 0.03 0.04 0.05 0.06 0.07 0.08 0.09 0.5000 0.5040 0.5080 0.5120 0.5160 0.5199 0.5239 0.5279 0.5319 0.5359 0.5398 0.5438 0.5478 0.5517 0.5557 0.5596 0.5636 0.5675 0.5714 0.5754 0.5793 0.5832 0.58710.59100.5948 0.59870.6026 0.6064 0.6103 0.6141 0.6179 0.62170.6255 0.6293 0.6331 0.6368 0.6406 0.6443 0.6480 0.6517 0.6554 0.6591 0.6628 0.6664 0.6700 0.6736 0.6772 0.6808 0.6844 0.6879 0.6915 0.6950 0.6985 0.7019 0.7054 0.7088 0.7123 0.7157 0.7190 0.7224 07258 10.7201 10 7221.1.2.7257 10 73991.071221 71540 ZABR In 75180.7540 Print Done 10-12 Anantan. Bilam 20 Data table Osp very thes Jen with kost 95 is $1 perc allow inveil 0.6 0.7 0.8 0.9 1.0 1.1 1.2 1.3 0.7258 0.7291 0.7324 0.7357 0.7389 0.7422 0.745407486 0.75180.7549 0.7580 0.7612 0.76420.7673 0.7704 0.7734 0.7764 0.779407823 0.7852 0.7881 0.7910 0.7939 0.7967 0.7996 0.8023 0.8051 0.8079 0.8106 0.8133 0.81590.8186 0.8212 0.8238 0.8264 0.82890.8315 0 8340 0.8365 0.8389 0.84130.8438 0.8461 0.84850.85080.8531 0.8554 0.8577 0.8599 0.8621 0.8643 0.8665 0.8686 0.8708 0.8729 0.87490.8770 0.8790 0.88100 8830 0.88490 8869 0.8888 0.89070 8925 0.8944 0.8962 0.8980 0.8997 0.9015 0.9032 0.9049 0.9066 0.9082 0.9099 0.9115 0.9131 09147 0.9162 0.9177 0.9192 0.9207 0.9222 0.9236 0.9251 0.9265 0.9279 0.9292 0.9306 0.9319 09332 0.0345 0.9357 0.93700.93820.9394 0.9406 0.9418 0.9430 09441 0452 OORLOA LOR 05. In on 011n0210645 a. W b. W on UN 1.4 1.6 Print Done 10S1 PM Desktop 31F i nantian 42 Droblar 22 LALOAREA. OC ON 42 AE od 46 monte Data table re X spil uery hes s $1 perce allow anver hen with cost 95 1.5 1.6 1.7 1.8 1.9 2.0 2.1 2.2 2.3 2.4 0.9332 0.9345 0.93570.9370 0.93820.93940.94060 94180 9430 0.9441 0.9452 0.9463 0.94740.9485 0.9495 0.9505 0.9515 0.9525 0 9535 0.9545 0.9554 0.9564 0.9573 0.9582 0.9591 0.9599 0.9608 0.9616 09625 0.9633 0.96410.9649 0.9656 0.9664 0.9671 09678 0.9686 0.9693 0.9700 0.9706 0.9713 0.9719 0.9726 0.9732 0.9738 09744 0.9750 0.9756 0.9762 09767 0.9773 0.9778 0.9783 0.9788 0.9793 0.9798 0.9803 0.9808 0.98120.9817 0.98210.9826 0.9830 0.98340 9838 0.9842 0.9846 0.98500 98540.9857 0.9861 0.9865 0.9868 0.98710.98750.9878 0.9881 09884 09887 09890 0.9893 0.9896 0.9898 0.9901 0.9904 0 9906 09909 0.9911 0.991309916 0.9918 0.9920 0.9922 0.9925099270 9929 0.9931 0.9932 0.99340.9036 nous noon 0041 0.00421 0045 0.000000000500053 a. WIL b. W Print Done VETU Tracey Gray & 11/25/21 10:53 PM M ortion 4. Droblar 29 LRALCA. 00 AM 10 NE cinta le Data table Ospil very en with Cost 95 the s is $1 perce allow inver NNNNNN CONDONO 2.4 2.5 2.6 2.7 2.8 2.9 3.0 3.1 3.2 3.3 0.9918 0.9920 0.9922 0.99250 9927 0.9929 0.9931 0.9932 0.9934 0 9936 0.9938 0.9940 0.99410.99430.9945 0.99460.99480.99490 99510.9952 0.9953 0.9955 0.9956 0.9957 0.9959 0.9960 0.9961 0.9962 0.9963 0.9964 0.9965 0.9966 0.99670.9968 0.9969 0.9970 | 0.9971 0.9972 0.99730.9974 0.9974 0 9975 0.9976 0.9977 0.9977 0.9978 0.9979 0.9980 0.9980 0.9981 0 9981 0.99820.9983 0.9983 0.9984 0.9984 0.9985 0.9985 0.9986 0 9986 0.9987 0.9987 0.99870 9988 0.9988 0.9989 0.9989 0.9989 0.99900 9990 0.9990 0.9991 0.9991 0.9991 0.9992 0.9992 0.9992 0.9992 0.9993 0.9993 0.9993 0.9993 0.99940.9994 0.9994 0.99940.9994 0.9995 0.9995 0.9995 0.9995 0.9995 0.9995 0.9995 0.9996 0.99960 9996 0.9996 0.9998 0.9997 a. W b. W Print Done PI OLAF Save Try again. x The reorder point, R, is determined by it $ 8 st er al + ZOLT ure has been ace orders with ty holding cost maintain a 95 s a year to reviow er 9 N where d is the average weekly (or daily or monthly) demand, L is the average weekly (or daily or monthly) lead time, z is found by using the standard normal distribution table for the desired service level, and out is the standard deviation of demand during the lead time. When both the demand and the lead time are variable, the standard deviation of demand during the lead time is determined by 327 er 2 OK ck answer Try again. where u is the average weekly (or any or moniniy) demand, L IS the ave weekly (or daily or monthly) lead time, z is found by using the standard n distribution table for the desired service level, and Odlt is the standard de of demand during the lead time. When both the demand and the lead time are variable, the standard devi demand during the lead time is determined by: OULT = Vga t% of Lo + 2 LT where Od is the standard deviation of weekly (or daily or monthly) deman OLT is the standard deviation of the lead time. Try again. -Sports opular wit plier is $ O/lurelyei at cycle-se the owner ory syster where d is the average weekly (or daily or monthly) demand, Lis the average weekly (or daily or monthly) lead time, z is found by using the standard normal distribution table for the desired service level, and out is the standard deviation of demand during the lead time. ure has been sce orders with ty holding cost maintain a 95 5 a year to review When both the demand and the lead time are variable, the standard deviation of demand during the lead time is determined by: at order a at reorder ALT = JLo + co2 where og is the standard deviation of weekly (or daily or monthly) demand and 0 is the standard deviation of the lead time OK ck answer rint
Can i have help with B. pleas
Step by Step Solution
There are 3 Steps involved in it
1 Expert Approved Answer
Step: 1 Unlock

Question Has Been Solved by an Expert!
Get step-by-step solutions from verified subject matter experts
Step: 2 Unlock
Step: 3 Unlock