

Question: Challenge 1 - Pivot Table and Chart Find a list of the Canadian provinces at Canadian Provinces by Population 2 0 2 2 ( worldpopulationreview.com
Challenge Pivot Table and Chart
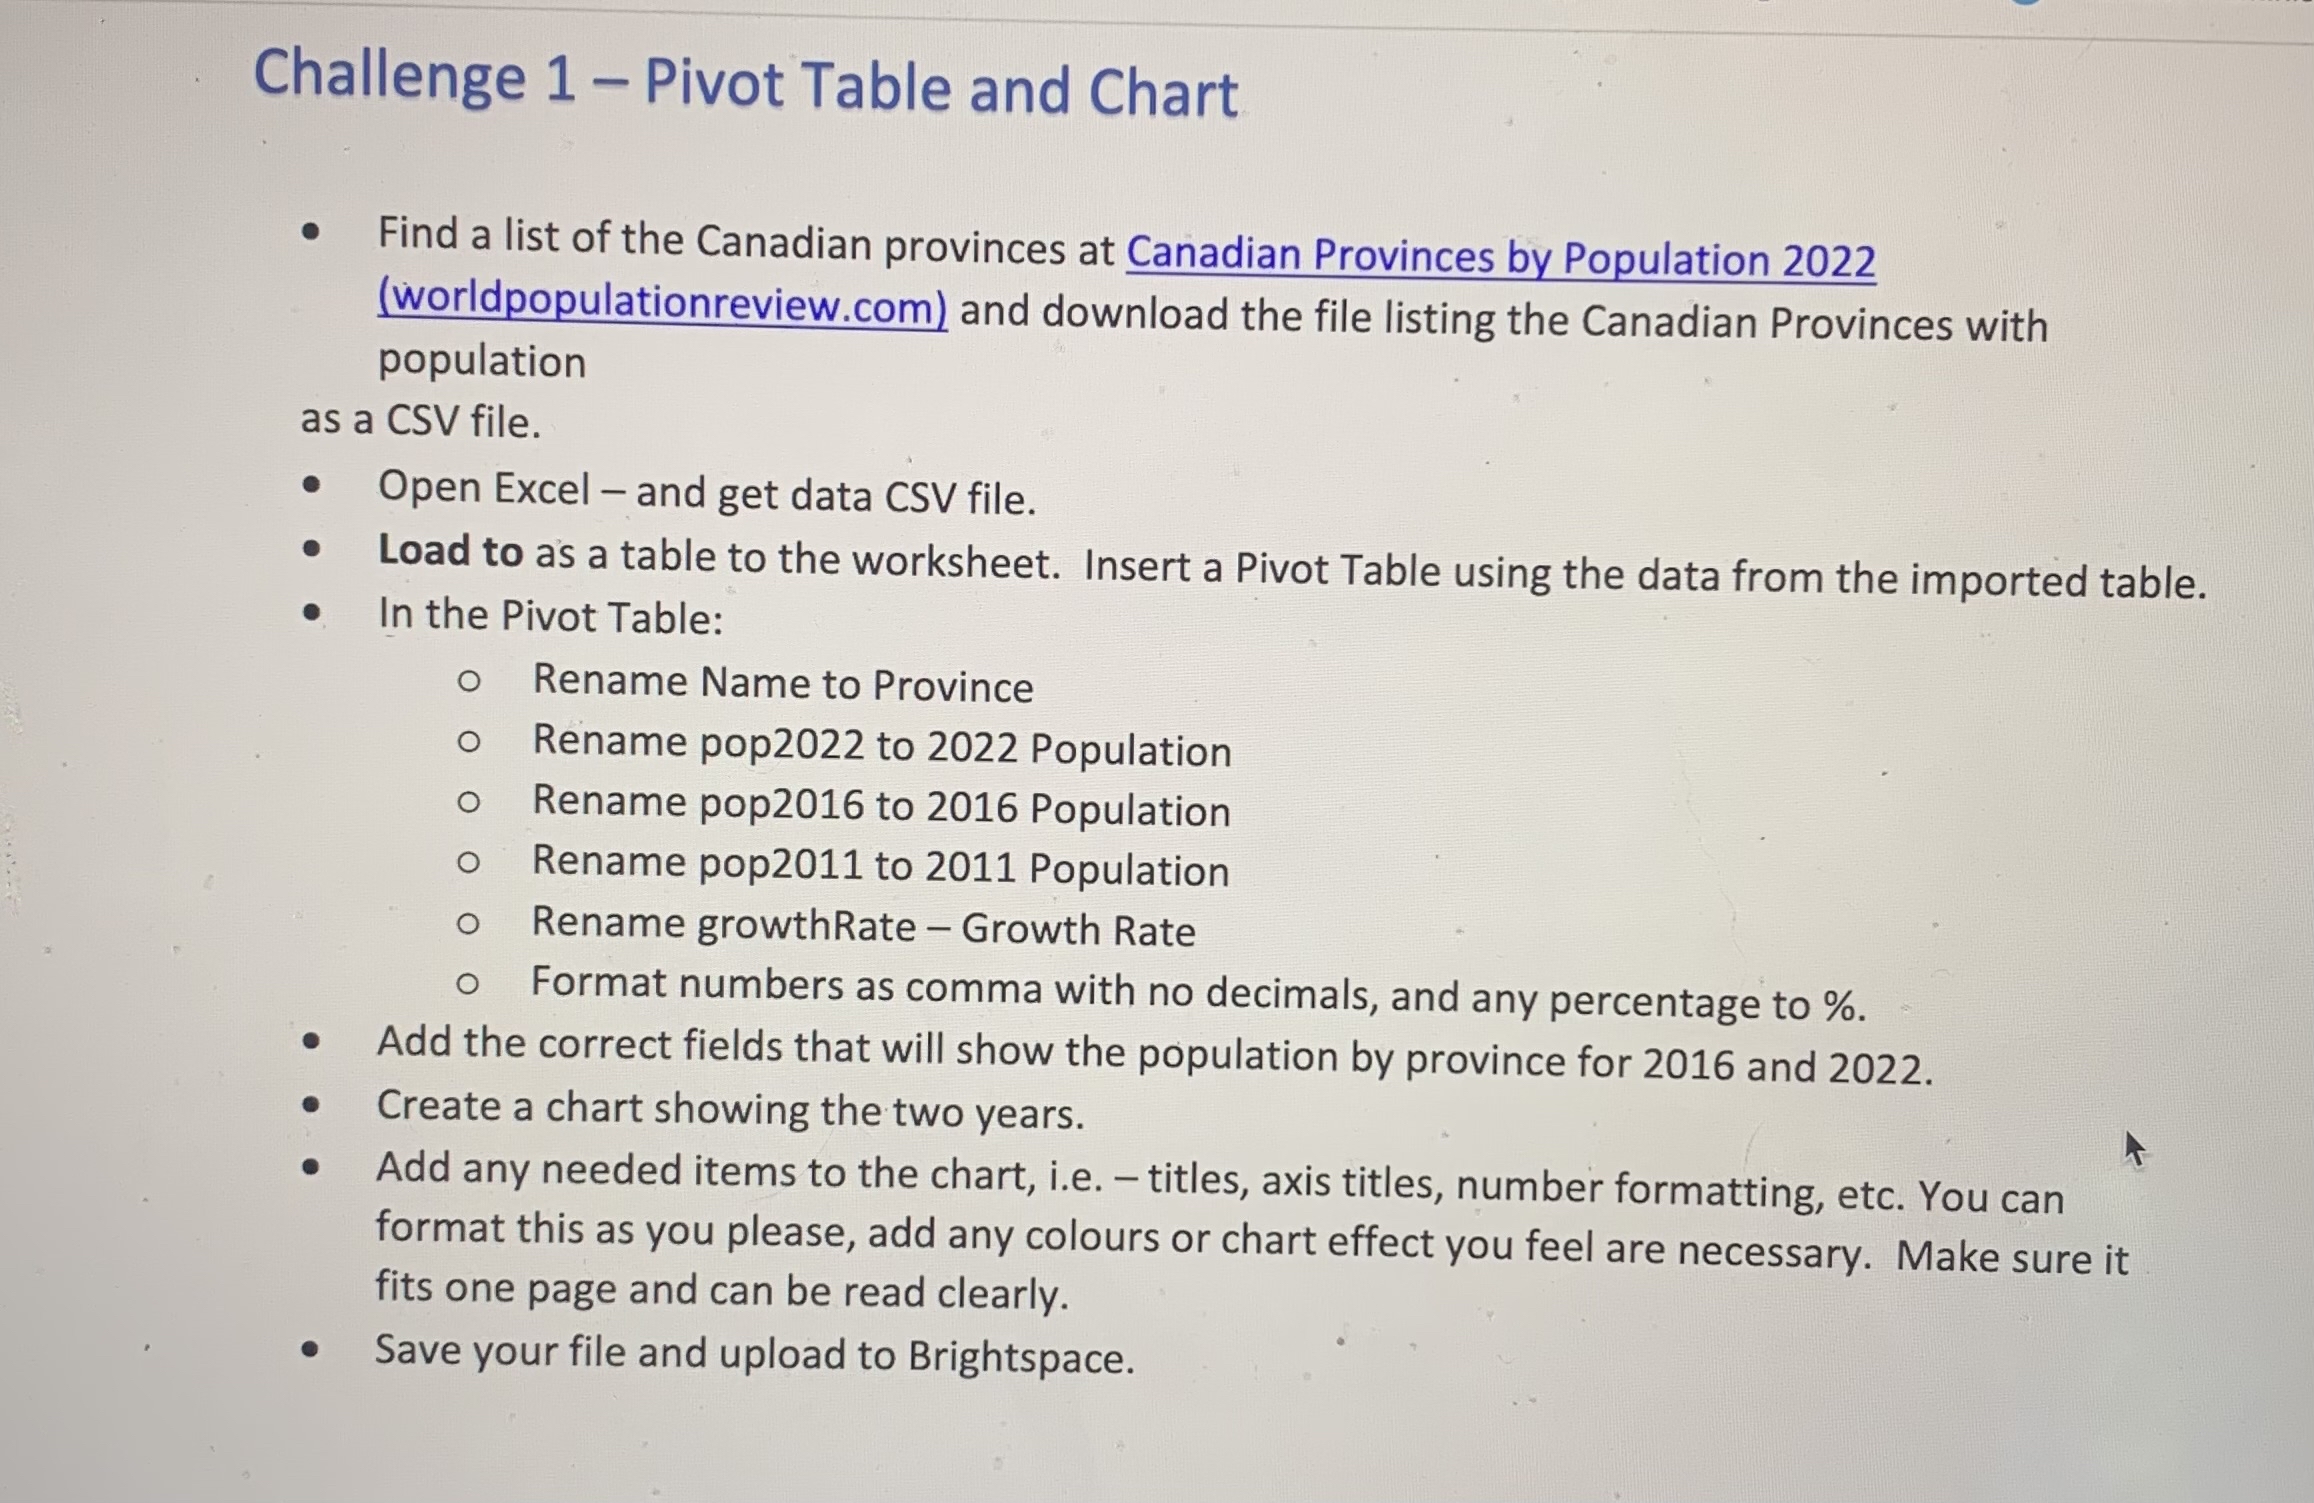
Find a list of the Canadian provinces at Canadian Provinces by Population
worldpopulationreview.com and download the file listing the Canadian Provinces with population
as a CSV file.
Open Excel and get data CSV file.
Load to as a table to the worksheet. Insert a Pivot Table using the data from the imported table.
In the Pivot Table:
Rename Name to Province
Rename pop to Population
Rename pop to Population
Rename pop to Population
Rename growthRate Growth Rate
Format numbers as comma with no decimals, and any percentage to
Add the correct fields that will show the population by province for and
Create a chart showing the two years.
Add any needed items to the chart, ie titles, axis titles, number formatting, etc. You can format this as you please, add any colours or chart effect you feel are necessary. Make sure it fits one page and can be read clearly.
Save your file and upload to Brightspace.
Step by Step Solution
There are 3 Steps involved in it
1 Expert Approved Answer
Step: 1 Unlock

Question Has Been Solved by an Expert!
Get step-by-step solutions from verified subject matter experts
Step: 2 Unlock
Step: 3 Unlock