

Question: Challenge question: Histogram of word lengths Write a function plot _ word _ length _ histogran ( filenane ) that reads a file and plots
Challenge question: Histogram of word lengths
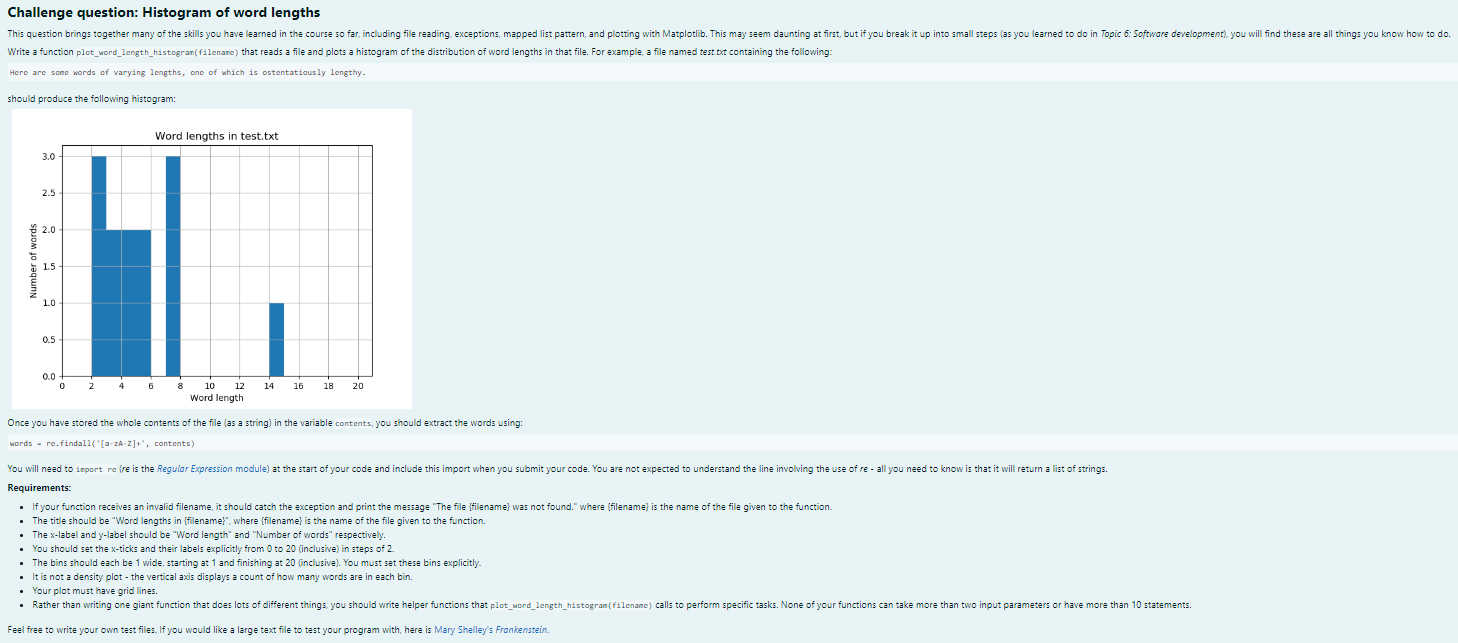
Write a function plotwordlengthhistogranfilenane that reads a file and plots a histogram of the distribution of word lengths in that file. For example, a file named test toxt containing the following:
Here are some words of varying lengths, one of which is ostentatiously lengthy.
should produce the following histogram:
Once you have stored the whole contents of the file as a string in the variable contents, you should extract the words using:
words refindall contents
Requirements:
If your function receives an invalid filename, it should catch the exception and print the message "The file filename was not found." where filename is the name of the file given to the function.
The title should be "Word lengths in filename where filename is the name of the file given to the function.
The label and label should be "Word length" and "Number of words" respectively.
You should set the ticks and their labels explicitly from to inclusive in steps of
The bins should each be wide, starting at and finishing at inclusive You must set these bins explicitly.
It is not a density plot the vertical axis displays a count of how many words are in each bin.
Your plot must have grid lines.
Feel free to write your own test files. If you would like a large text file to test your program with, here is Mary Shelley's Frankenstein.
Step by Step Solution
There are 3 Steps involved in it
1 Expert Approved Answer
Step: 1 Unlock

Question Has Been Solved by an Expert!
Get step-by-step solutions from verified subject matter experts
Step: 2 Unlock
Step: 3 Unlock