

Question: Change in Quantity Supplied vs. Shift in Supply. Change in Quantity Supplied B Price Quantity of apples 6. Interpret the graph by answering the following

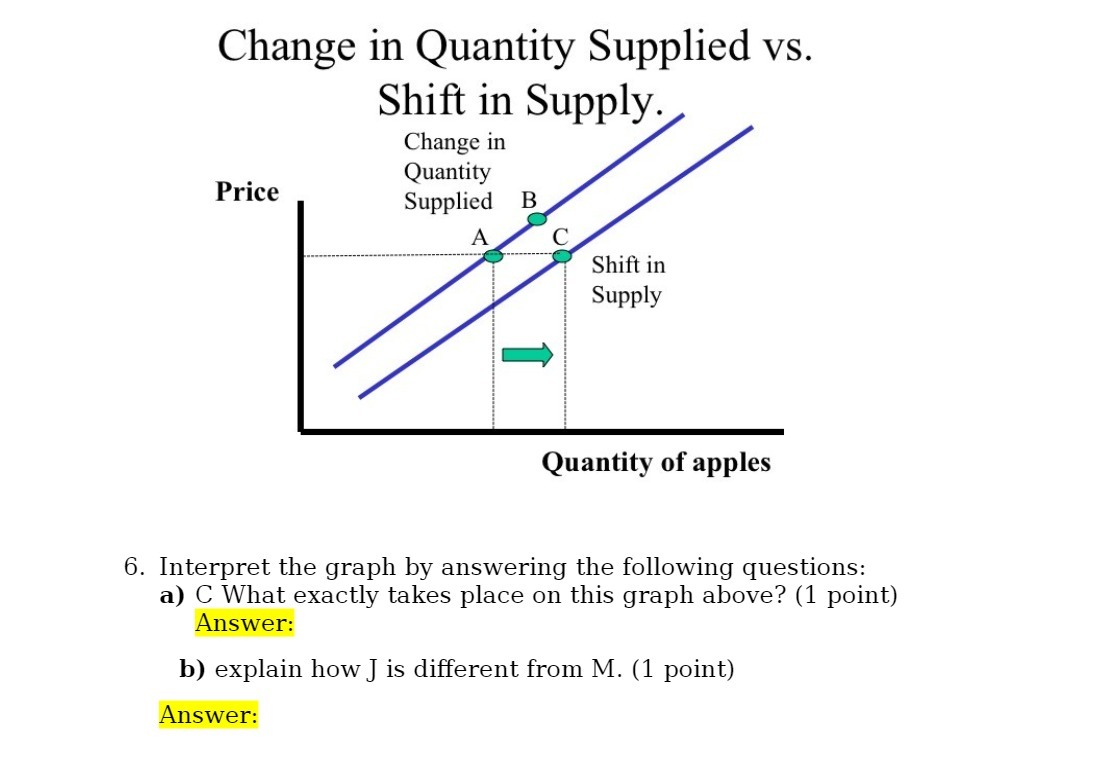
Change in Quantity Supplied vs. Shift in Supply. Change in Quantity Supplied B Price Quantity of apples 6. Interpret the graph by answering the following questions: a) C What exactly takes place on this graph above? (1 point) Answer: b) explain how] is different from M. (1 point)
Step by Step Solution
There are 3 Steps involved in it
1 Expert Approved Answer
Step: 1 Unlock

Question Has Been Solved by an Expert!
Get step-by-step solutions from verified subject matter experts
Step: 2 Unlock
Step: 3 Unlock