

Question: chap 4 #7 Data for Barry Computer Co. and its industry averages follow. The firm's debt is priced at par, so the market value of
chap 4 #7
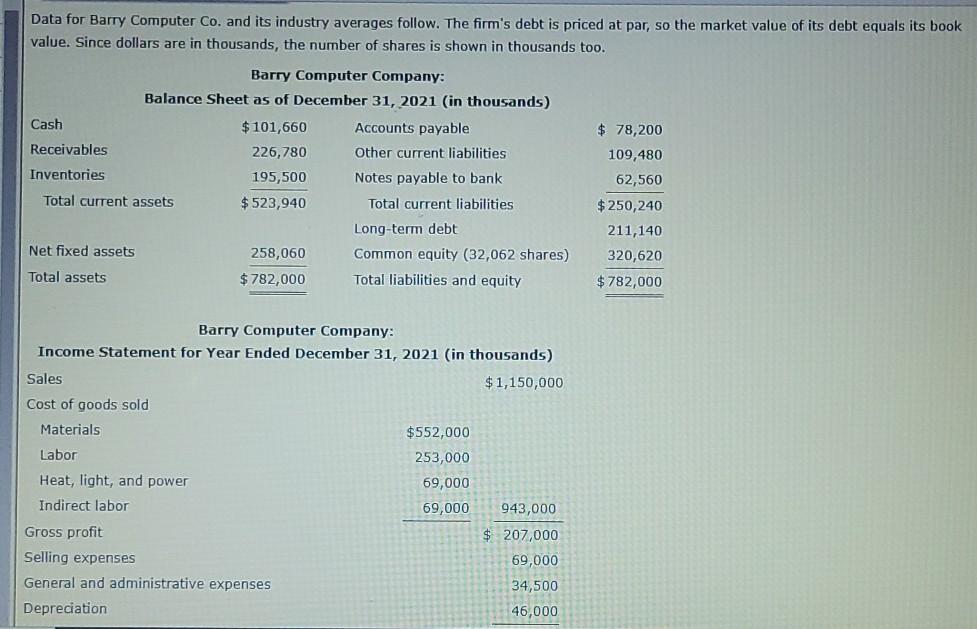
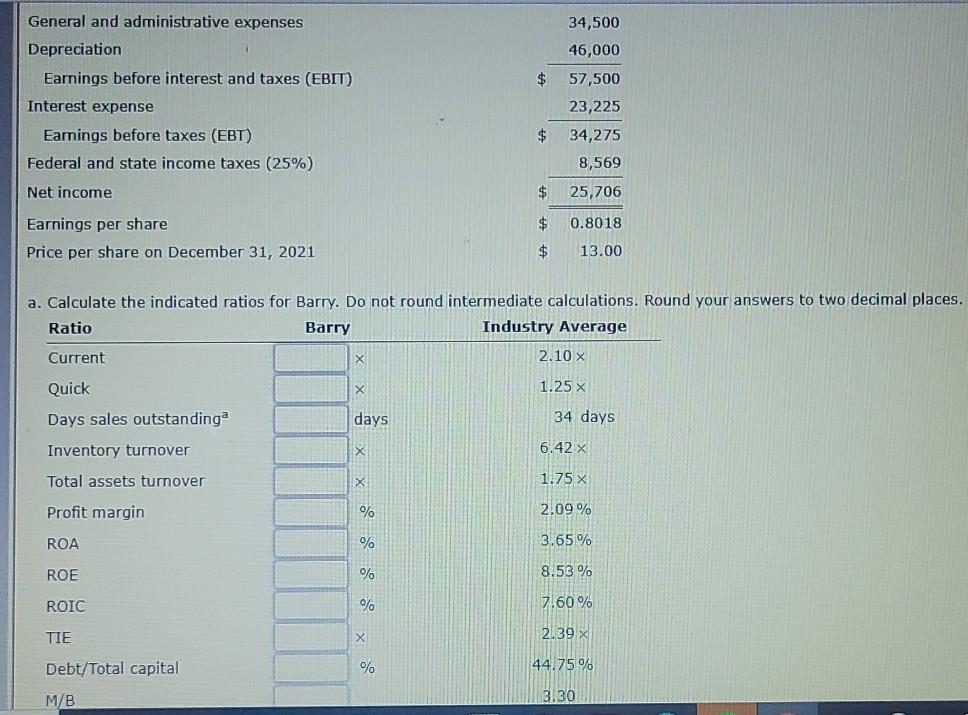
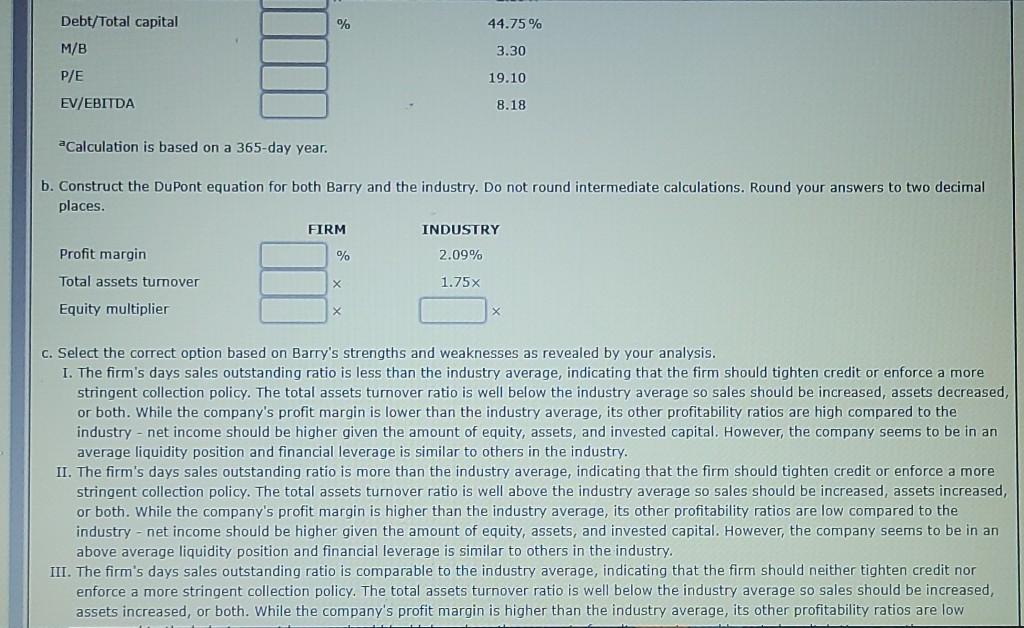
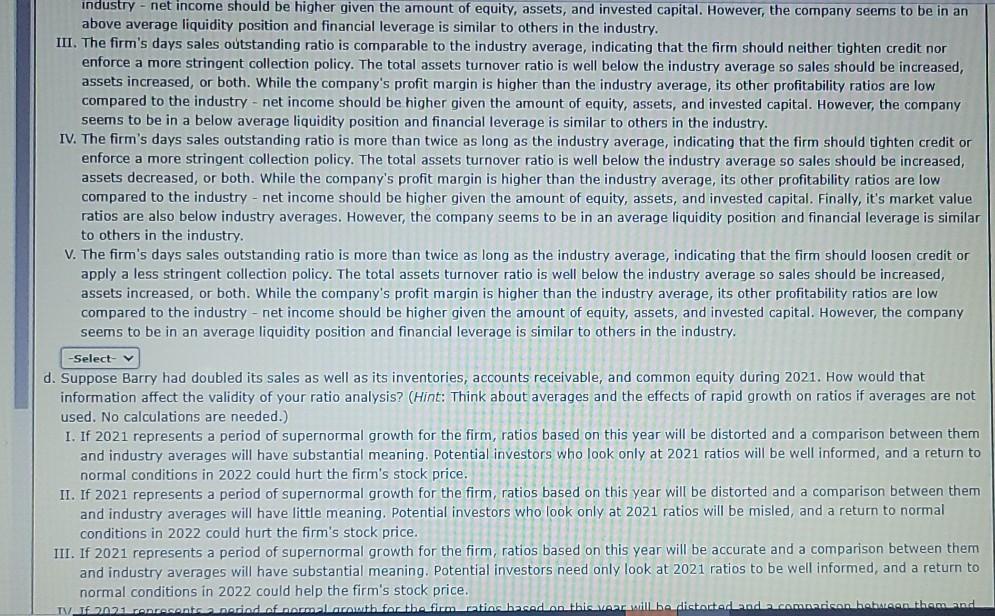
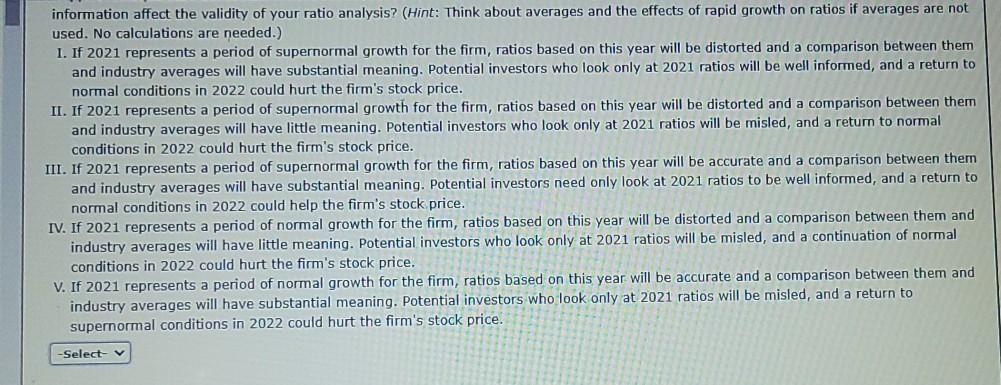
Data for Barry Computer Co. and its industry averages follow. The firm's debt is priced at par, so the market value of its debt equals its book value. Since dollars are in thousands, the number of shares is shown in thousands too. Barry Computer Company: Balance Sheet as of December 31, 2021 (in thousands) Cash $ 101,660 Accounts payable Receivables 226,780 Other current liabilities Inventories 195,500 Notes payable to bank Total current assets $ 523,940 Total current liabilities Long-term debt Net fixed assets 258,060 Common equity (32,062 shares) Total assets $782,000 Total liabilities and equity $ 78,200 109,480 62,560 $250,240 211,140 320,620 $ 782,000 Barry Computer Company: Income Statement for Year Ended December 31, 2021 (in thousands) Sales $1,150,000 Cost of goods sold Materials $552,000 Labor 253,000 Heat, light, and power 69,000 Indirect labor 69,000 943,000 Gross profit $ 207,000 Selling expenses 69,000 General and administrative expenses 34,500 Depreciation 46,000 34,500 46,000 57,500 $ General and administrative expenses Depreciation Earnings before interest and taxes (EBIT) Interest expense Earnings before taxes (EBT) Federal and state income taxes (25%) 23,225 $ 34,275 8,569 Net income $ 25,706 $ 0.8018 Earnings per share Price per share on December 31, 2021 $ 13.00 a. Calculate the indicated ratios for Barry. Do not round intermediate calculations. Round your answers to two decimal places. Ratio Barry Industry Average Current 2.10 x X X 1.25 x Quick Days sales outstandinga days 34 days Inventory turnover X 6.42 x Total assets turnover X 1.75 X Profit margin % 2.09 % ROA % 3.65 % ROE % 8.53 % ROIC % 7.60% TIE x 2.39 x Debt/Total capital % 44.75% M/B 3.30 Debt/Total capital % 44.75% M/B 3.30 P/E 19.10 EV/EBITDA 8.18 a Calculation is based on a 365-day year. b. Construct the DuPont equation for both Barry and the industry. Do not round intermediate calculations. Round your answers to two decimal places. FIRM INDUSTRY Profit margin % 2.09% Total assets turnover X 1.75x Equity multiplier C. Select the correct option based on Barry's strengths and weaknesses as revealed by your analysis. I. The firm's days sales outstanding ratio is less than the industry average, indicating that the firm should tighten credit or enforce a more stringent collection policy. The total assets turnover ratio is well below the industry average so sales should be increased, assets decreased, or both. While the company's profit margin is lower than the industry average, its other profitability ratios are high compared to the industry - net income should be higher given the amount of equity, assets, and invested capital. However, the company seems to be in an average liquidity position and financial leverage is similar to others in the industry. II. The firm's days sales outstanding ratio is more than the industry average, indicating that the firm should tighten credit or enforce a more stringent collection policy. The total assets turnover ratio is well above the industry average so sales should be increased, assets increased, or both. While the company's profit margin is higher than the industry average, its other profitability ratios are low compared to the industry - net income should be higher given the amount of equity, assets, and invested capital. However, the company seems to be in an above average liquidity position and financial leverage is similar to others in the industry. III. The firm's days sales outstanding ratio is comparable to the industry average, indicating that the firm should neither tighten credit nor enforce a more stringent collection policy. The total assets turnover ratio is well below the industry average so sales should be increased, assets increased, or both. While the company's profit margin is higher than the industry average, its other profitability ratios are low industry - net income should be higher given the amount of equity, assets, and invested capital. However, the company seems to be in an above average liquidity position and financial leverage is similar to others in the industry. III. The firm's days sales outstanding ratio is comparable to the industry average, indicating that the firm should neither tighten credit nor enforce a more stringent collection policy. The total assets turnover ratio is well below the industry average so sales should be increased, assets increased, or both. While the company's profit margin is higher than the industry average, its other profitability ratios are low compared to the industry - net income should be higher given the amount of equity, assets, and invested capital. However, the company seems to be in a below average liquidity position and financial leverage is similar to others in the industry. IV. The firm's days sales outstanding ratio is more than twice as long as the industry average, indicating that the firm should tighten credit or enforce a more stringent collection policy. The total assets turnover ratio is well below the industry average so sales should be increased, assets decreased, or both. While the company's profit margin is higher than the industry average, its other profitability ratios are low compared to the industry - net income should be higher given the amount of equity, assets, and invested capital. Finally, it's market value ratios are also below industry averages. However, the company seems to be in an average liquidity position and financial leverage is similar to others in the industry. V. The firm's days sales outstanding ratio is more than twice as long as the industry average, indicating that the firm should loosen credit or apply a less stringent collection policy. The total assets turnover ratio is well below the industry average so sales should be increased, assets increased, or both. While the company's profit margin is higher than the industry average, its other profitability ratios are low compared to the industry - net income should be higher given the amount of equity, assets, and invested capital. However, the company seems to be in an average liquidity position and financial leverage is similar to others in the industry. -Select- d. Suppose Barry had doubled its sales as well as its inventories, accounts receivable, and common equity during 2021. How would that information affect the validity of your ratio analysis? (Hint: Think about averages and the effects of rapid growth on ratios if averages are not used. No calculations are needed.) I. If 2021 represents a period of supernormal growth for the firm, ratios based on this year will be distorted and a comparison between them and industry averages will have substantial meaning. Potential investors who look only at 2021 ratios will be well informed, and a return to normal conditions in 2022 could hurt the firm's stock price. II. If 2021 represents a period of supernormal growth for the firm, ratios based on this year will be distorted and a comparison between them and industry averages will have little meaning. Potential investors who look only at 2021 ratios will be misled, and a return to normal conditions in 2022 could hurt the firm's stock price. III. If 2021 represents a period of supernormal growth for the firm, ratios based on this year will be accurate and a comparison between them and industry averages will have substantial meaning. Potential investors need only look at 2021 ratios to be well informed, and a return to normal conditions in 2022 could help the firm's stock price. TVT 21 conresantnerad finem Lacowth for the firm in nadon this verwill be distorted and comracion between thamand information affect the validity of your ratio analysis? (Hint: Think about averages and the effects of rapid growth on ratios if averages are not used. No calculations are needed.) 1. If 2021 represents a period of supernormal growth for the firm, ratios based on this year will be distorted and a comparison between them and industry averages will have substantial meaning. Potential investors who look only at 2021 ratios will be well informed, and a return to normal conditions in 2022 could hurt the firm's stock price. II. If 2021 represents a period of supernormal growth for the firm, ratios based on this year will be distorted and a comparison between them and industry averages will have little meaning. Potential investors who look only at 2021 ratios will be misled, and a return to normal conditions in 2022 could hurt the firm's stock price. III. If 2021 represents a period of supernormal growth for the firm, ratios based on this year will be accurate and a comparison between them and industry averages will have substantial meaning. Potential investors need only look at 2021 ratios to be well informed, and a return to normal conditions in 2022 could help the firm's stock price. IV. If 2021 represents a period of normal growth for the firm, ratios based on this year will be distorted and a comparison between them and industry averages will have little meaning. Potential investors who look only at 2021 ratios will be misled, and a continuation of normal conditions in 2022 could hurt the firm's stock price. V. If 2021 represents a period of normal growth for the firm, ratios based on this year will be accurate and a comparison between them and industry averages will have substantial meaning. Potential investors who look only at 2021 ratios will be misled, and a return to supernormal conditions in 2022 could hurt the firm's stock price. -Select
Step by Step Solution
There are 3 Steps involved in it

Get step-by-step solutions from verified subject matter experts