

Question: Chapter 07 Homework 4. Consumer surplus for an individual and a market The following graph plots Ana's monthly demand curve (blue line) for burrito bowls.
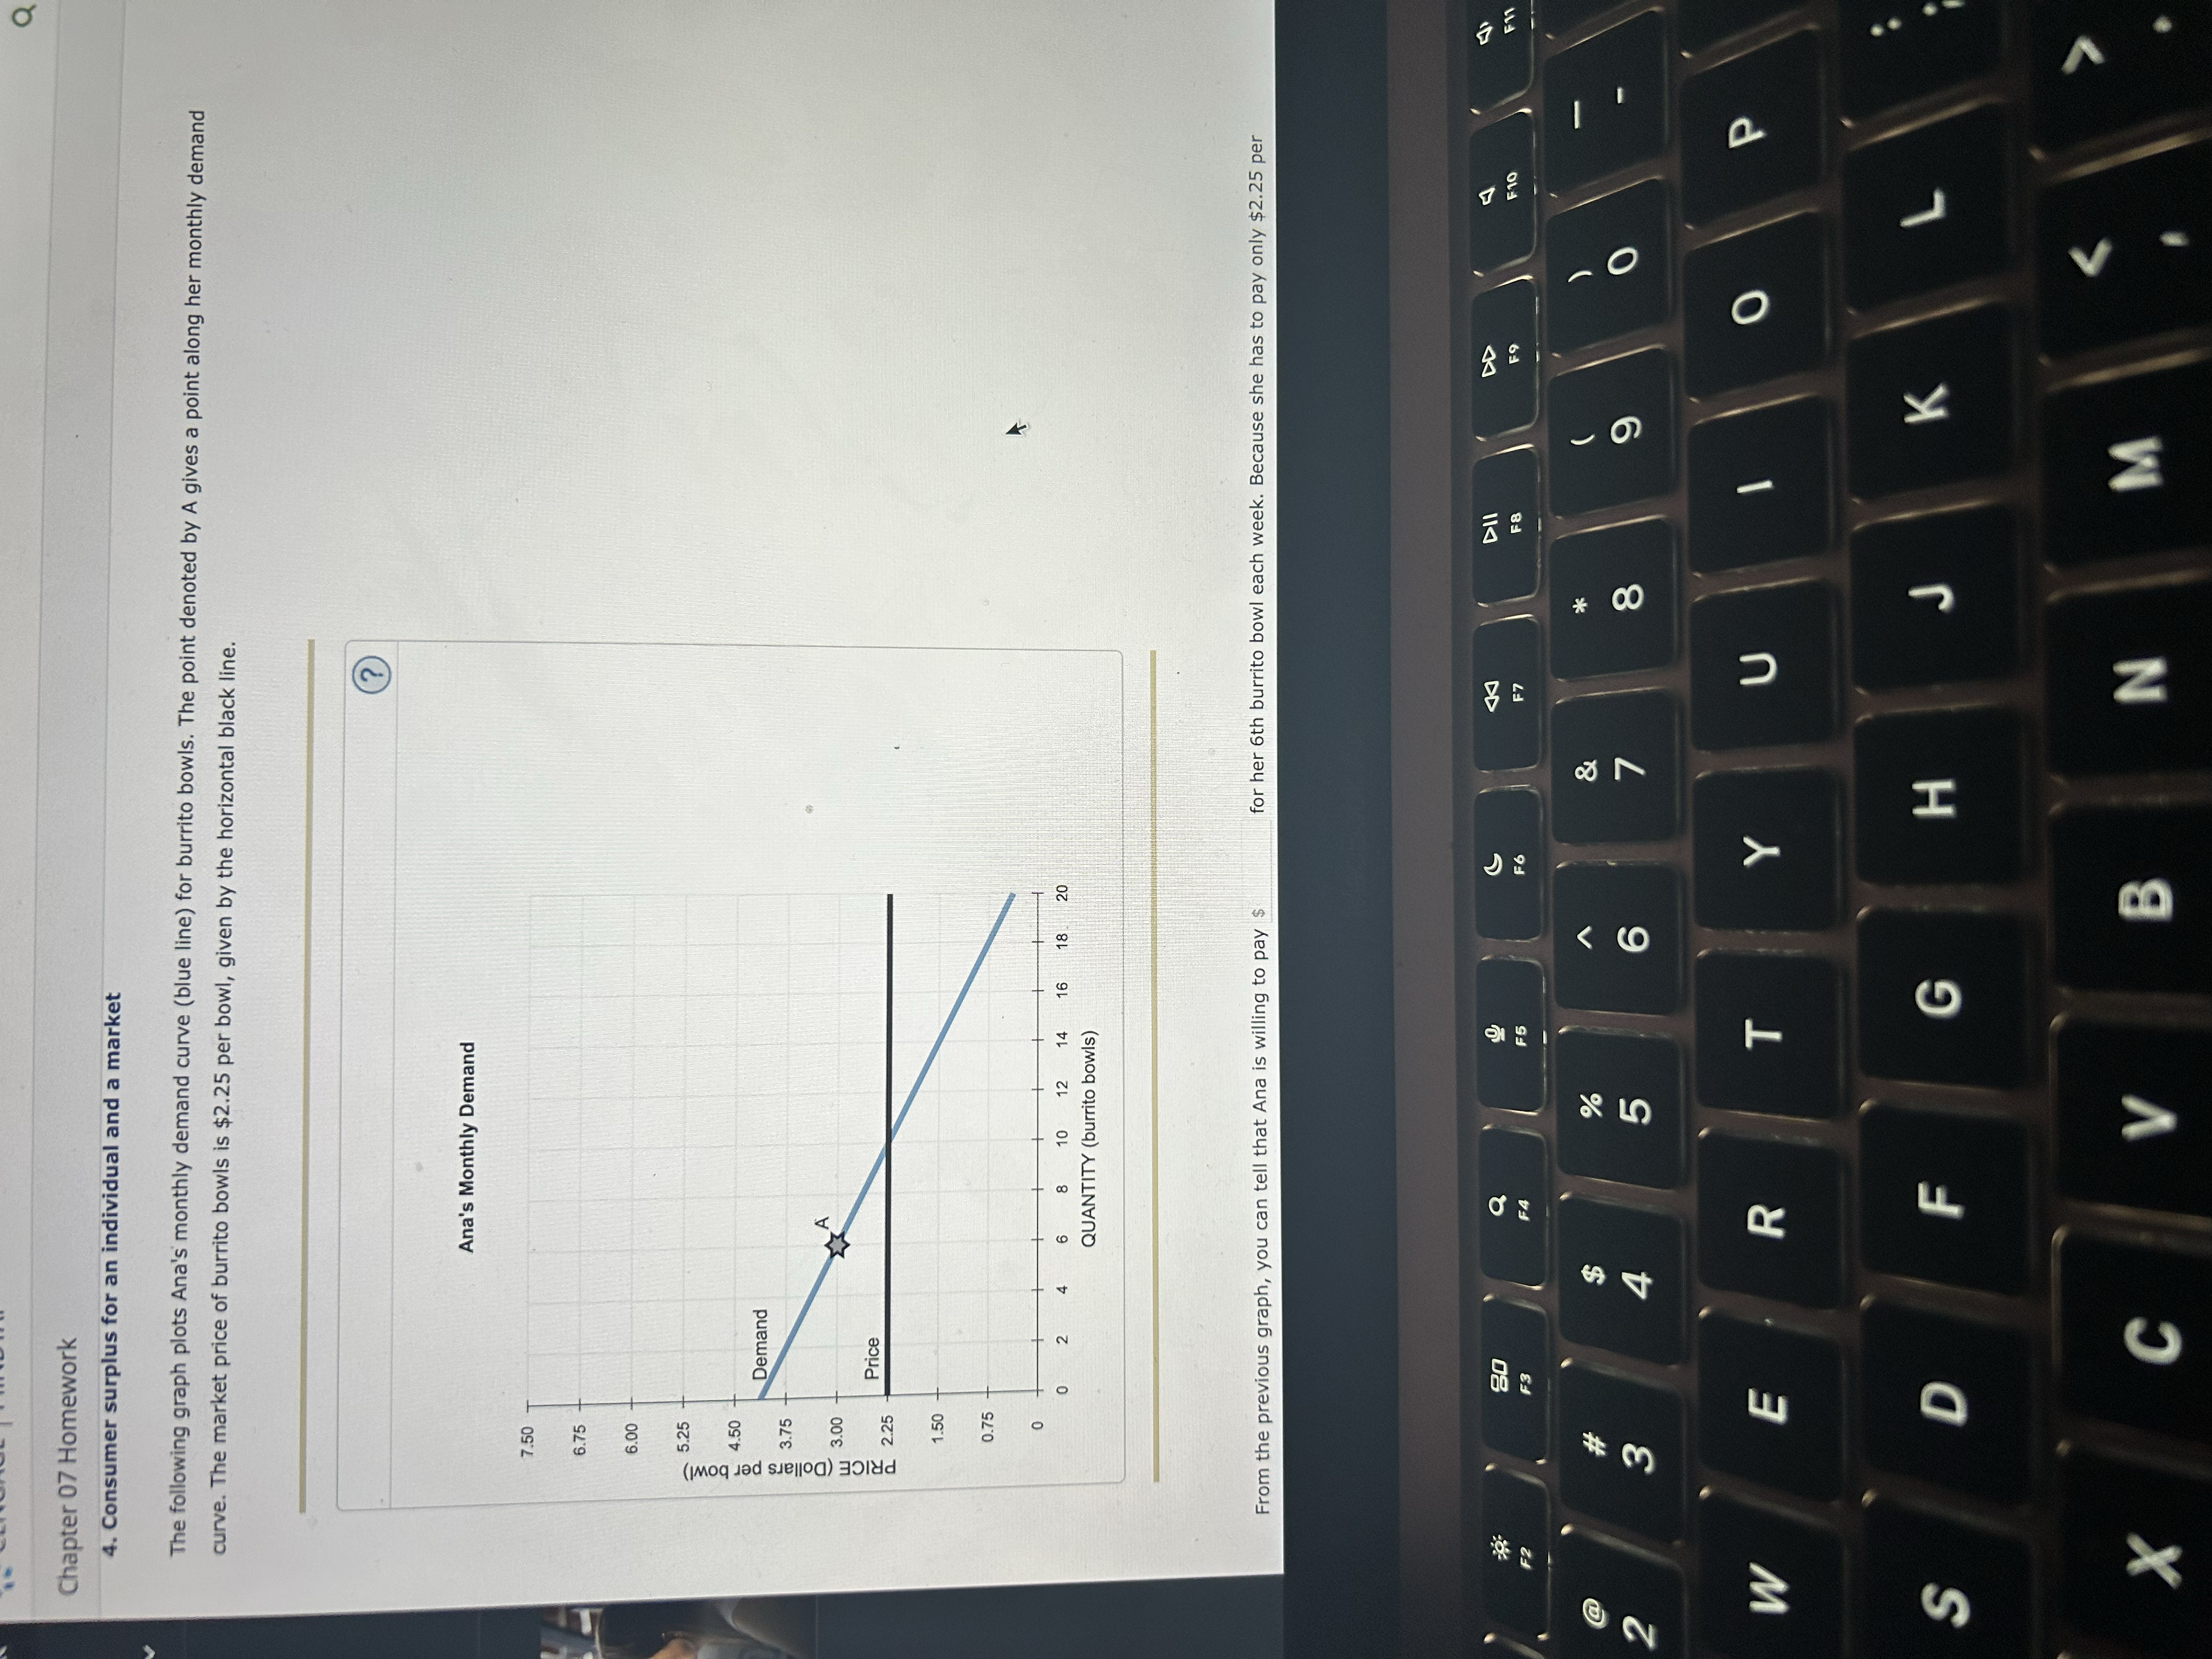

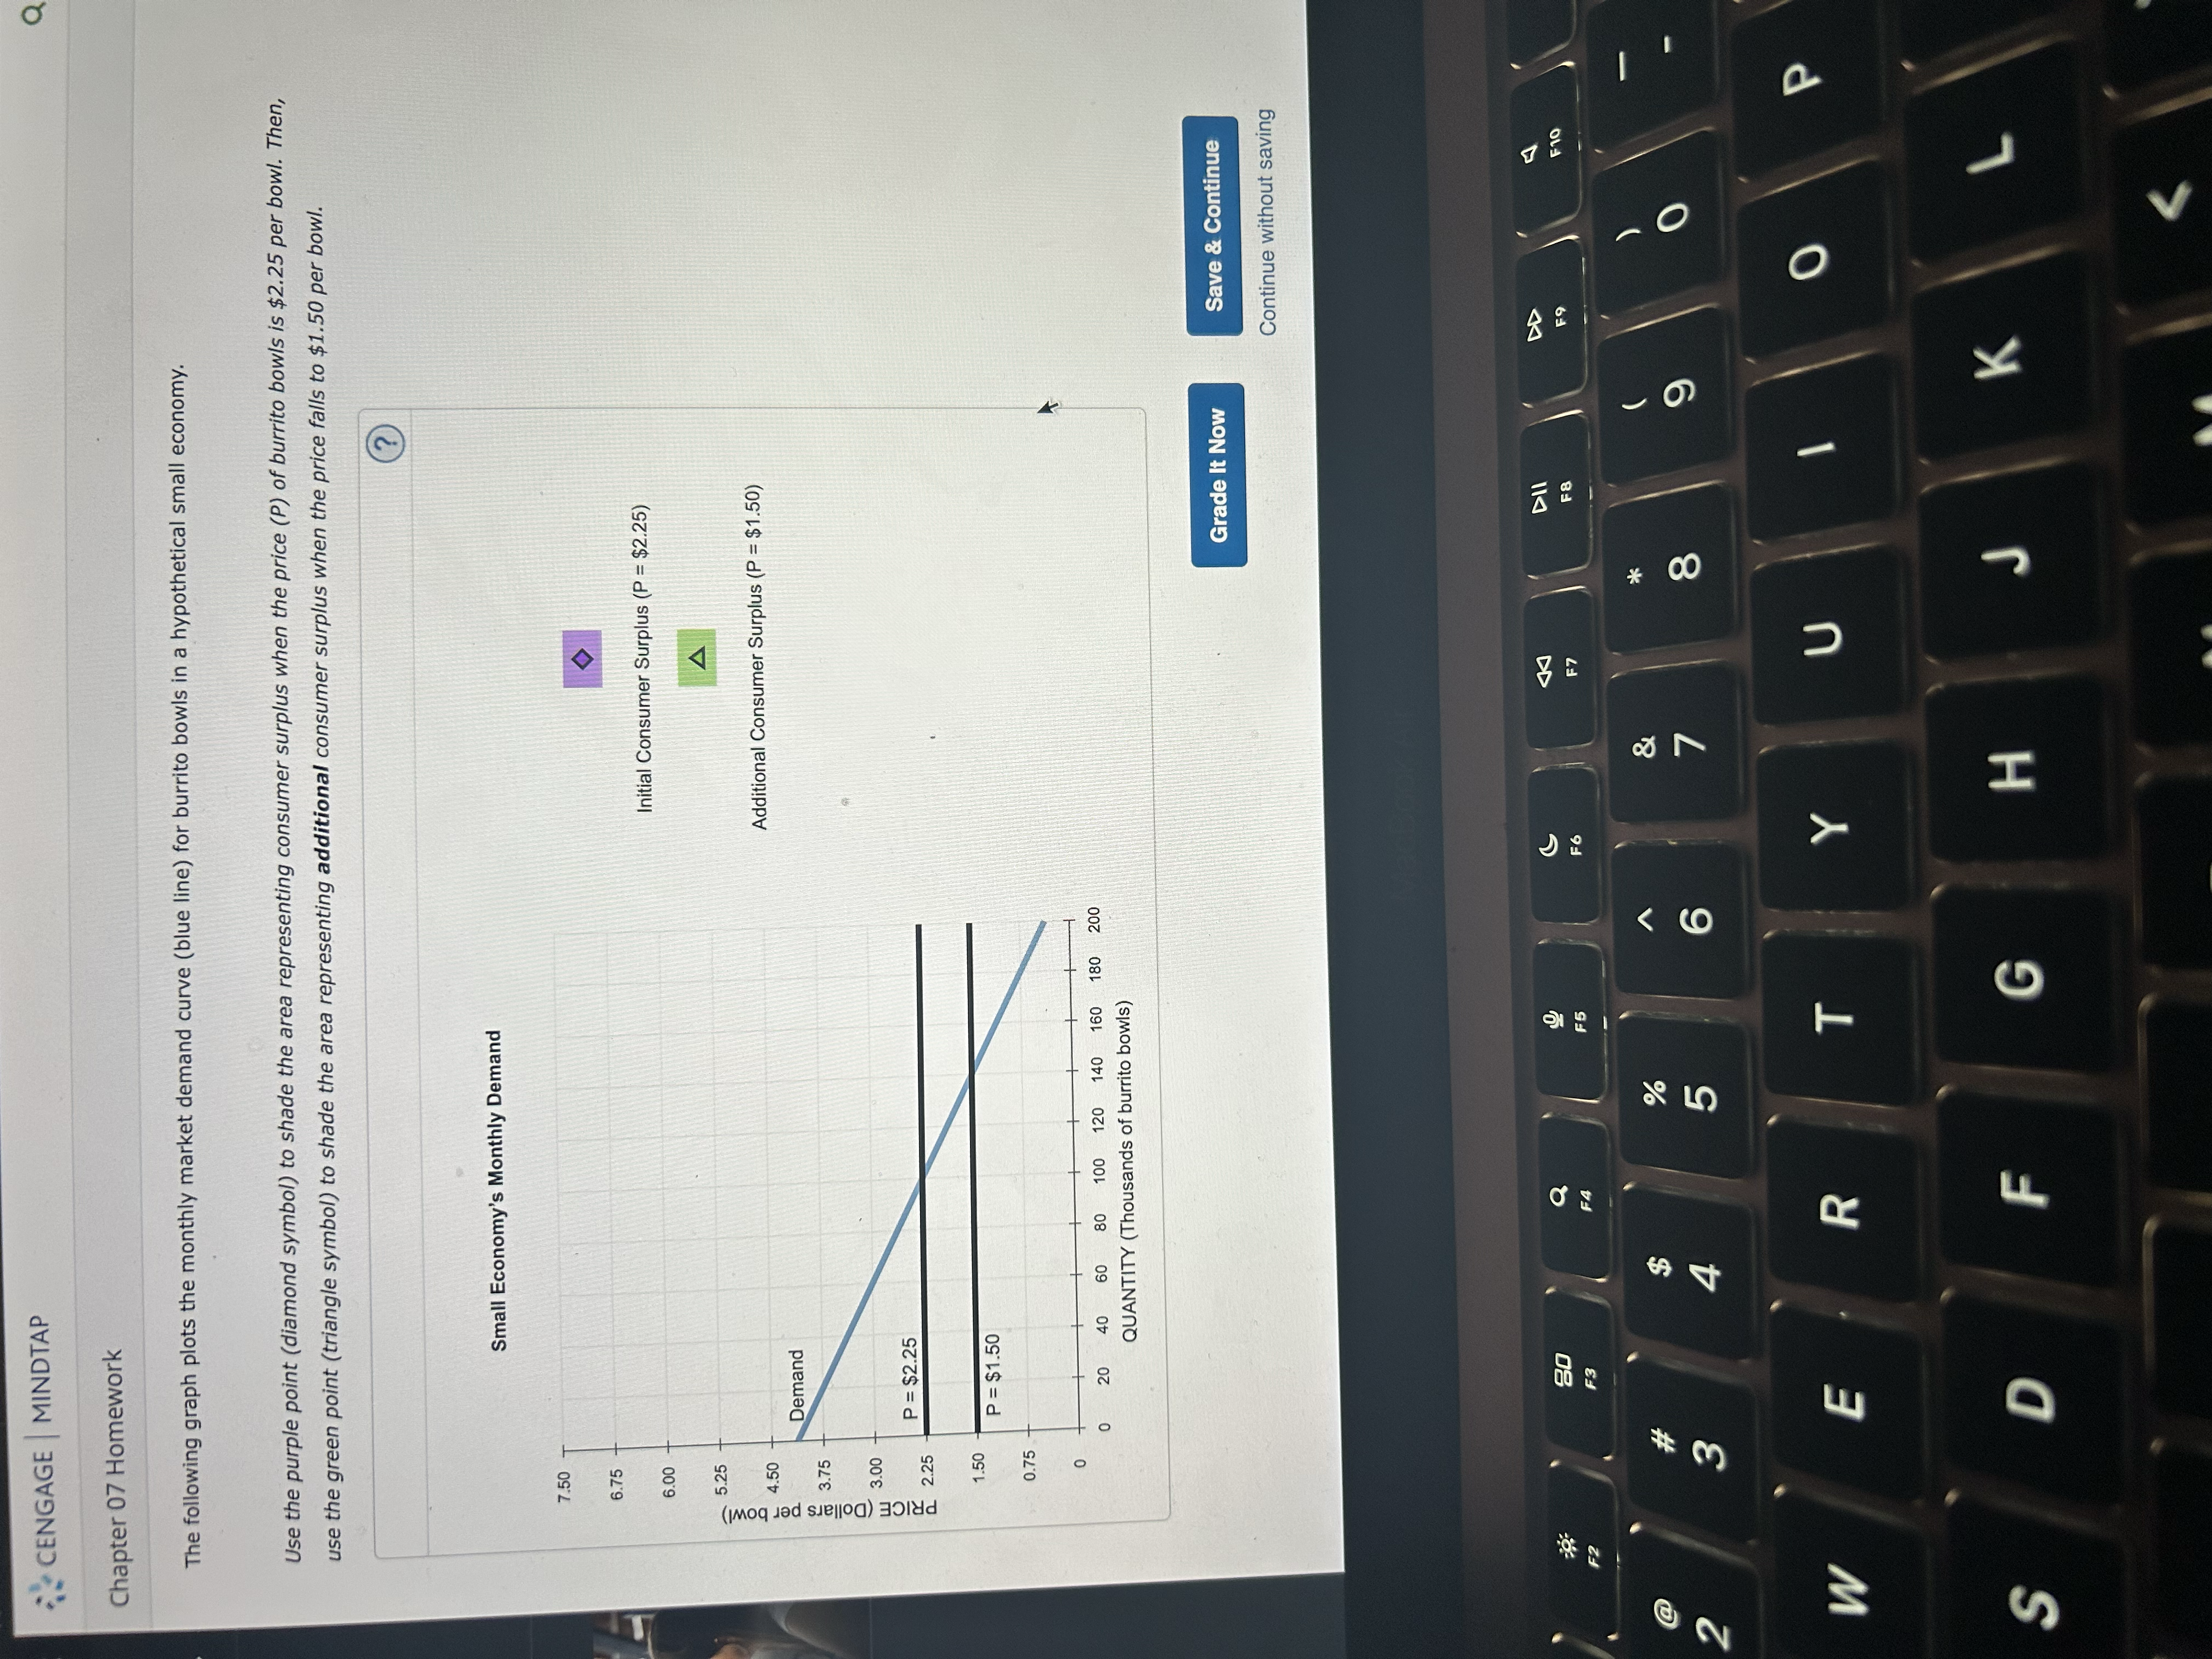

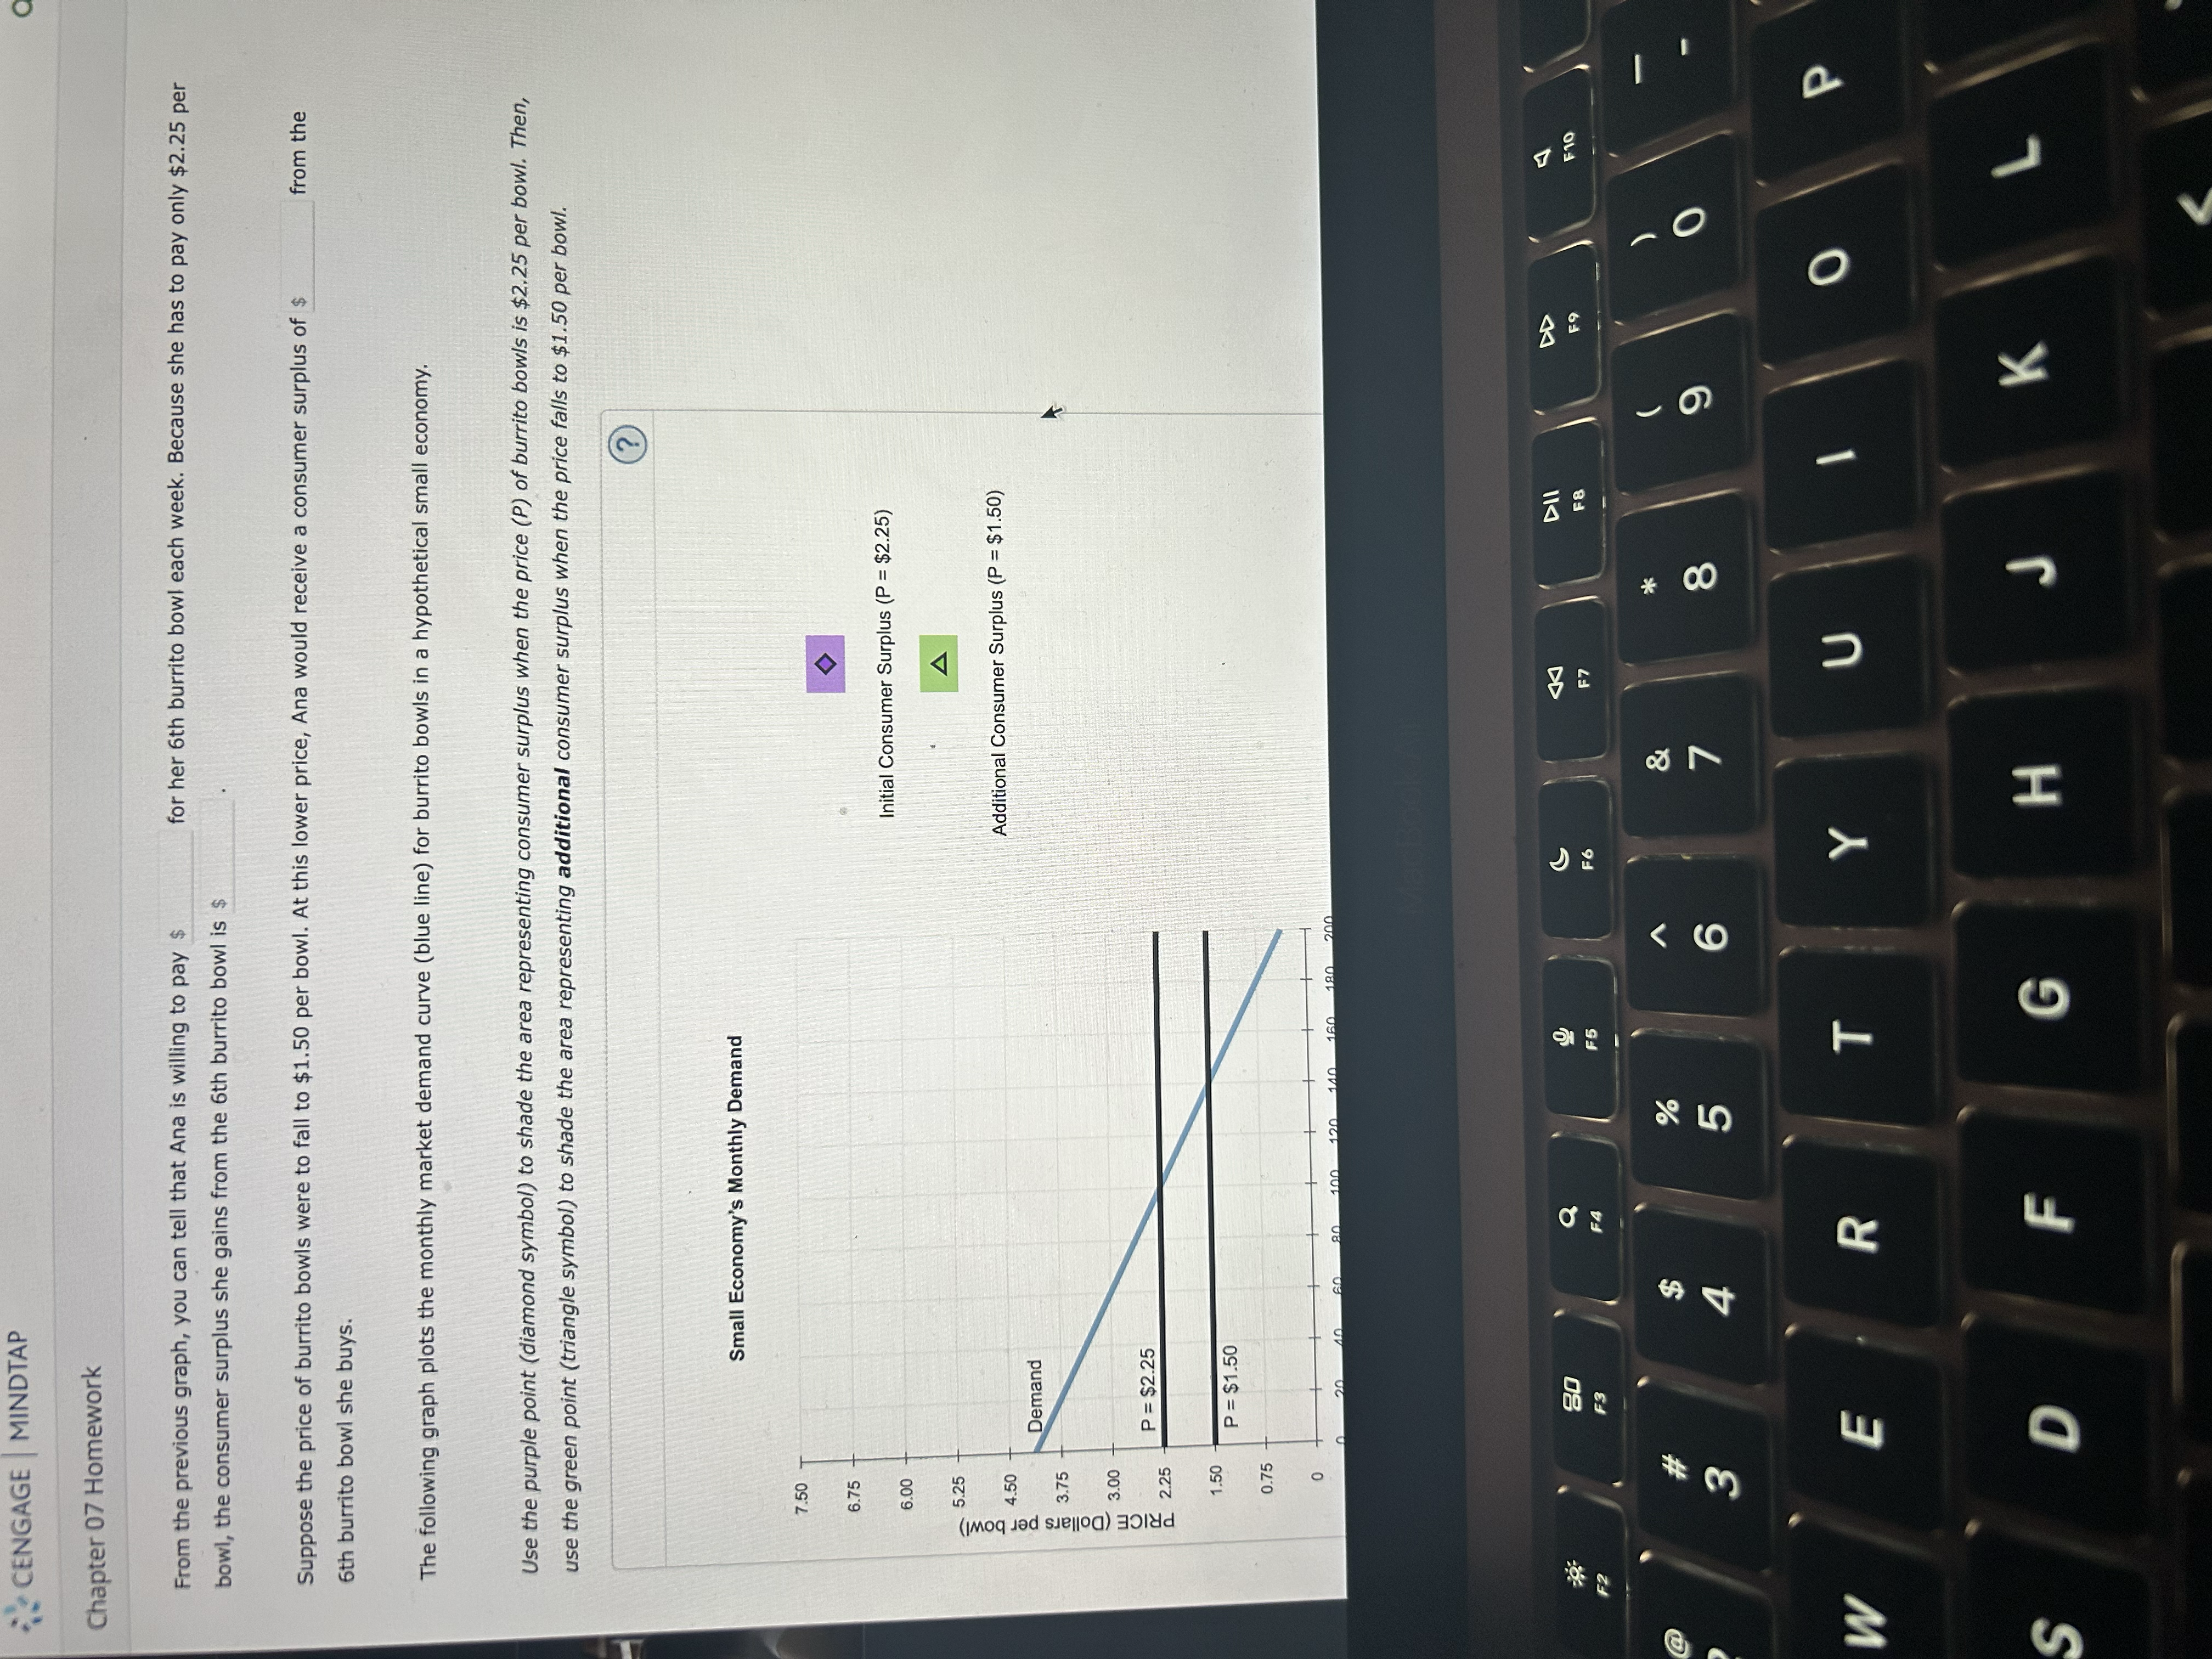

Chapter 07 Homework 4. Consumer surplus for an individual and a market The following graph plots Ana's monthly demand curve (blue line) for burrito bowls. The point denoted by A gives a point along her monthly demand curve. The market price of burrito bowls is $2.25 per bowl, given by the horizontal black line. Ana's Monthly Demand 7.50 6.75 6.00 5.25 4.50 Demand 3.75 PRICE (Dollars per bowl LL 3.00 A Price 2.25 1.50 0.75 0 2 4 6 8 10 12 14 16 18 20 QUANTITY (burrito bowls) From the previous graph, you can tell that Ana is willing to pay $ for her 6th burrito bowl each week. Because she has to pay only $2.25 per 7 F11 * OO 28 LO
Step by Step Solution
There are 3 Steps involved in it

Get step-by-step solutions from verified subject matter experts