

Question: Chapter 09. Solution for Ch 09-10 Build a Model Zieber Corporation's 2012 financial Statements are shown below. Forecast Zolber's 2013 income statement and balance sheets.
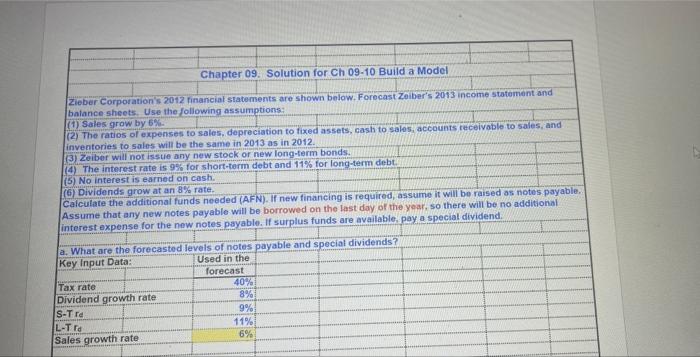
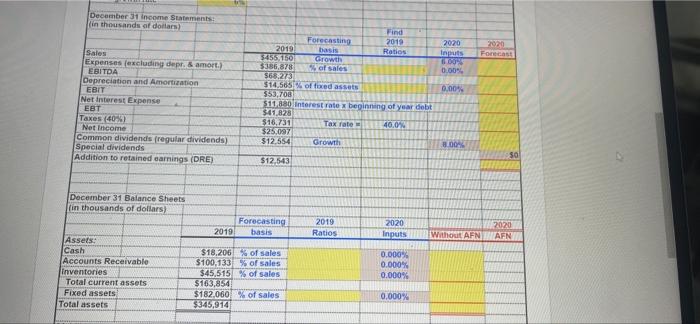
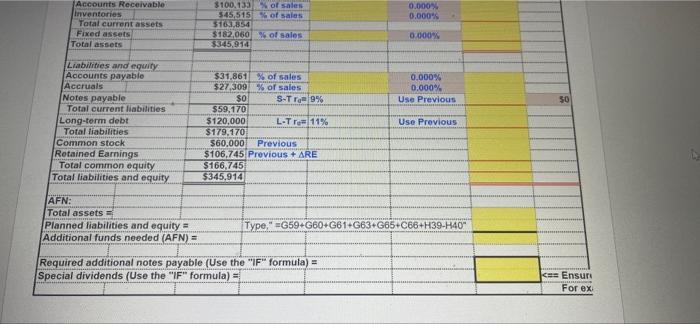
Chapter 09. Solution for Ch 09-10 Build a Model Zieber Corporation's 2012 financial Statements are shown below. Forecast Zolber's 2013 income statement and balance sheets. Use the following assumptions: (1) Sales grow by 6% (2) The ratio of expenses to sales, depreciation to fixed assets, cash to sales, accounts receivable to sales, and inventories to sales will be the same in 2013 as in 2012. (3) Zeiber will not issue any new stock or new long-term bonds. (4) The interest rate is 9% for short-term debt and 11% for long-term debt. (5) No interest is earned on cash (6) Dividends grow at an 8% rate. Calculate the additional funds needed (AFN). If new financing is required, assume it will be raised as notes payable. Assume that any new notes payable will be borrowed on the last day of the year, so there will be no additional interest expense for the new notes payable. If surplus funds are available, pay a special dividend. a. What are the forecasted levels of notes payable and special dividends? Key Input Data: Used in the forecast Tax rate 40% Dividend growth rate 8% S-Tre 9% L-Trg 11% Sales growth rate 6% December 1 income Statements in thousands of dollars) 2020 Forecast Sales Expenses (excluding depr. & amort) EBITDA Depreciation and Amortization EBIT Net interest Expense EBT Taxes (40%) Net Income Common dividends fregular dividends) Special dividends Addition to retained earnings (DRE) Find Forecasting 2019 2020 2019 basis Ratios Inputs 3455,1501 Growth 100 3336,878 of sales 0.00 $6273 $14,563 of foxed assets 0.00% $53,708 $11. Interest rate beginning of year debt $41,828 $16,731 Tax rate 40.01 $25.097 $12.554 Growth DO SO $12,543 December 31 Balance Sheets in thousands of dollars) Forecasting 2019 basis 2019 Ratios 2020 Inputs Without AFN 2020 AFN Assets Cash Accounts Receivable Inventories Total current assets Fixed assets Total assets $18,206 % of sales $100,133 % of sales $45,515 % of sales $163,854 $182,060 % of sales $325,914 0.000" 0.000 0.000% 0.000% 0.000 0.000% Accounts Receivable Inventories Total current assets Fixed assets Total assets 3100.133 of sales 545,515 S of sales $161.854 $182,060 % of sales 3345,914 0.000% 0.000% 0.000% Use Previous 30 Liabilities and equity Accounts payable Accruals Notes payable Total current liabilities Long-term debt Total liabilities Common stock Retained Earnings Total common equity Total liabilities and equity Use Previous $31,861 % of sales $27,309 % of sales $0 S- T996 $59,170 $120,000 L-T 11% $179,170 $60,000 Previous $106,745 Previous + ARE $166,745 $345,914 AFN: Total assets Planned liabilities and equity = Additional funds needed (AFN) = Type," =G59+G60+G61+G63 C66+H39-140" Required additional notes payable (Use the "IF formula) = Special dividends (Use the "IF formula) = Ces Ensure For ex
Step by Step Solution
There are 3 Steps involved in it

Get step-by-step solutions from verified subject matter experts