

Question: Chapter 1: Measuring Corporate Performance: Analyzing Financial Statements Case Study: Corporate Lending Group: The Hobby Horse Company, Inc. (HH) Burchetts Green had enjoyed the bank
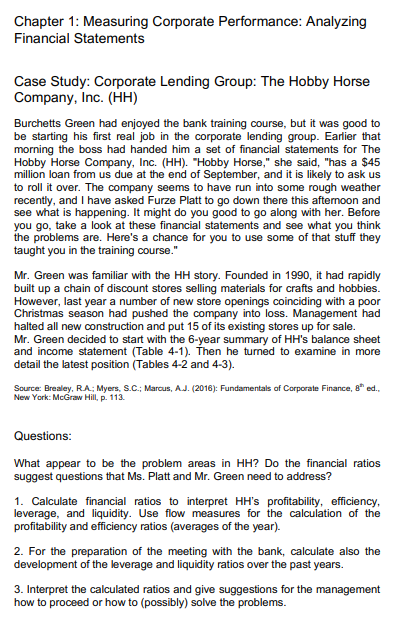
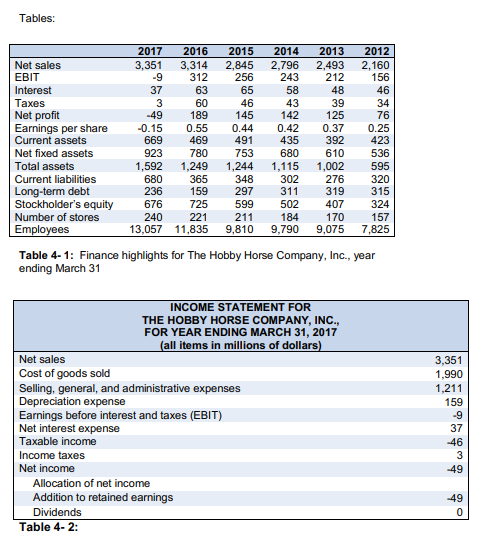
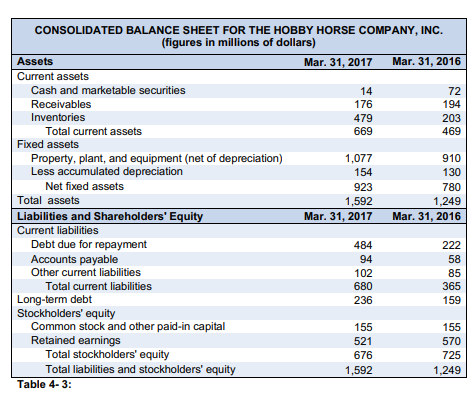
Chapter 1: Measuring Corporate Performance: Analyzing Financial Statements Case Study: Corporate Lending Group: The Hobby Horse Company, Inc. (HH) Burchetts Green had enjoyed the bank training course, but it was good to be starting his first real job in the corporate lending group. Earlier that morning the boss had handed him a set of financial statements for The Hobby Horse Company, Inc. (HH). "Hobby Horse," she said, "has a $45 million loan from us due at the end of September, and it is likely to ask us to roll it over. The company seems to have run into some rough weather recently, and I have asked Furze Platt to go down there this afternoon and see what is happening. It might do you good to go along with her. Before you go, take a look at these financial statements and see what you think the problems are. Here's a chance for you to use some of that stuff they taught you in the training course." Mr. Green was familiar with the HH story. Founded in 1990, it had rapidly built up a chain of discount stores selling materials for crafts and hobbies. However, last year a number of new store openings coinciding with a poor Christmas season had pushed the company into loss. Management had halted all new construction and put 15 of its existing stores up for sale. Mr. Green decided to start with the 6-year summary of HH's balance sheet and income statement (Table 4-1). Then he turned to examine in more detail the latest position (Tables 4-2 and 4-3). Source: Brealey, R.A: Myers, S.C., Marcus, A.J. (2016): Fundamentals of Corporate Finance, e* ed.. New York: McGraw Hill, p. 113. Questions: What appear to be the problem areas in HH? Do the financial ratios suggest questions that Ms. Platt and Mr. Green need to address? 1. Calculate financial ratios to interpret HH's profitability, efficiency, leverage, and liquidity. Use flow measures for the calculation of the profitability and efficiency ratios (averages of the year). 2. For the preparation of the meeting with the bank, calculate also the development of the leverage and liquidity ratios over the past years. 3. Interpret the calculated ratios and give suggestions for the management how to proceed or how to (possibly) solve the problems. Tables: 2017 2016 2015 2014 2013 2012 Net sales 3,351 3,314 2,845 2,796 2,493 2,160 EBIT -9 312 256 243 212 156 Interest 37 63 65 58 48 46 Taxes 3 60 46 43 39 34 Net profit -49 189 145 142 125 76 Earnings per share -0.15 0.55 0.44 0.42 0.37 0.25 Current assets 669 469 491 435 392 423 Net fixed assets 923 780 753 680 610 536 Total assets 1,592 1,249 1,244 1,115 1,002 595 Current liabilities 680 365 348 302 276 320 Long-term debt 236 159 297 311 319 315 Stockholder's equity 676 725 599 502 407 324 Number of stores 240 221 211 184 170 157 Employees 13,057 11,835 9,810 9,790 9,075 7,825 Table 4-1: Finance highlights for The Hobby Horse Company, Inc., year ending March 31 INCOME STATEMENT FOR THE HOBBY HORSE COMPANY, INC., FOR YEAR ENDING MARCH 31, 2017 (all items in millions of dollars) Net sales Cost of goods sold Selling, general, and administrative expenses Depreciation expense Earnings before interest and taxes (EBIT) Net interest expense Taxable income Income taxes Net income Allocation of net income Addition to retained earnings Dividends Table 4-2: 3,351 1,990 1,211 159 -9 37 -46 3 -49 -49 0 CONSOLIDATED BALANCE SHEET FOR THE HOBBY HORSE COMPANY, INC. (figures in millions of dollars) Assets Mar. 31, 2017 Mar. 31, 2016 Current assets Cash and marketable securities 14 72 Receivables 176 194 Inventories 479 203 Total current assets 669 469 Fixed assets Property, plant, and equipment (net of depreciation) 1,077 910 Less accumulated depreciation 154 130 Net fixed assets 923 780 Total assets 1,592 1,249 Liabilities and Shareholders' Equity Mar. 31, 2017 Mar. 31, 2016 Current liabilities Debt due for repayment 484 222 Accounts payable 94 58 Other current liabilities 102 85 Total current liabilities 680 365 Long-term debt 236 159 Stockholders' equity Common stock and other paid-in capital 155 155 Retained earnings 521 570 Total stockholders' equity 676 725 Total liabilities and stockholders' equity 1,592 1,249 Table 4-3: Chapter 1: Measuring Corporate Performance: Analyzing Financial Statements Case Study: Corporate Lending Group: The Hobby Horse Company, Inc. (HH) Burchetts Green had enjoyed the bank training course, but it was good to be starting his first real job in the corporate lending group. Earlier that morning the boss had handed him a set of financial statements for The Hobby Horse Company, Inc. (HH). "Hobby Horse," she said, "has a $45 million loan from us due at the end of September, and it is likely to ask us to roll it over. The company seems to have run into some rough weather recently, and I have asked Furze Platt to go down there this afternoon and see what is happening. It might do you good to go along with her. Before you go, take a look at these financial statements and see what you think the problems are. Here's a chance for you to use some of that stuff they taught you in the training course." Mr. Green was familiar with the HH story. Founded in 1990, it had rapidly built up a chain of discount stores selling materials for crafts and hobbies. However, last year a number of new store openings coinciding with a poor Christmas season had pushed the company into loss. Management had halted all new construction and put 15 of its existing stores up for sale. Mr. Green decided to start with the 6-year summary of HH's balance sheet and income statement (Table 4-1). Then he turned to examine in more detail the latest position (Tables 4-2 and 4-3). Source: Brealey, R.A: Myers, S.C., Marcus, A.J. (2016): Fundamentals of Corporate Finance, e* ed.. New York: McGraw Hill, p. 113. Questions: What appear to be the problem areas in HH? Do the financial ratios suggest questions that Ms. Platt and Mr. Green need to address? 1. Calculate financial ratios to interpret HH's profitability, efficiency, leverage, and liquidity. Use flow measures for the calculation of the profitability and efficiency ratios (averages of the year). 2. For the preparation of the meeting with the bank, calculate also the development of the leverage and liquidity ratios over the past years. 3. Interpret the calculated ratios and give suggestions for the management how to proceed or how to (possibly) solve the problems. Tables: 2017 2016 2015 2014 2013 2012 Net sales 3,351 3,314 2,845 2,796 2,493 2,160 EBIT -9 312 256 243 212 156 Interest 37 63 65 58 48 46 Taxes 3 60 46 43 39 34 Net profit -49 189 145 142 125 76 Earnings per share -0.15 0.55 0.44 0.42 0.37 0.25 Current assets 669 469 491 435 392 423 Net fixed assets 923 780 753 680 610 536 Total assets 1,592 1,249 1,244 1,115 1,002 595 Current liabilities 680 365 348 302 276 320 Long-term debt 236 159 297 311 319 315 Stockholder's equity 676 725 599 502 407 324 Number of stores 240 221 211 184 170 157 Employees 13,057 11,835 9,810 9,790 9,075 7,825 Table 4-1: Finance highlights for The Hobby Horse Company, Inc., year ending March 31 INCOME STATEMENT FOR THE HOBBY HORSE COMPANY, INC., FOR YEAR ENDING MARCH 31, 2017 (all items in millions of dollars) Net sales Cost of goods sold Selling, general, and administrative expenses Depreciation expense Earnings before interest and taxes (EBIT) Net interest expense Taxable income Income taxes Net income Allocation of net income Addition to retained earnings Dividends Table 4-2: 3,351 1,990 1,211 159 -9 37 -46 3 -49 -49 0 CONSOLIDATED BALANCE SHEET FOR THE HOBBY HORSE COMPANY, INC. (figures in millions of dollars) Assets Mar. 31, 2017 Mar. 31, 2016 Current assets Cash and marketable securities 14 72 Receivables 176 194 Inventories 479 203 Total current assets 669 469 Fixed assets Property, plant, and equipment (net of depreciation) 1,077 910 Less accumulated depreciation 154 130 Net fixed assets 923 780 Total assets 1,592 1,249 Liabilities and Shareholders' Equity Mar. 31, 2017 Mar. 31, 2016 Current liabilities Debt due for repayment 484 222 Accounts payable 94 58 Other current liabilities 102 85 Total current liabilities 680 365 Long-term debt 236 159 Stockholders' equity Common stock and other paid-in capital 155 155 Retained earnings 521 570 Total stockholders' equity 676 725 Total liabilities and stockholders' equity 1,592 1,249 Table 4-3
Step by Step Solution
There are 3 Steps involved in it

Get step-by-step solutions from verified subject matter experts