Question: Chapter 1 Review Questions 1) The process of using sample statistics to draw conclusions about true population parameters is called A) sampling. B) the scientific
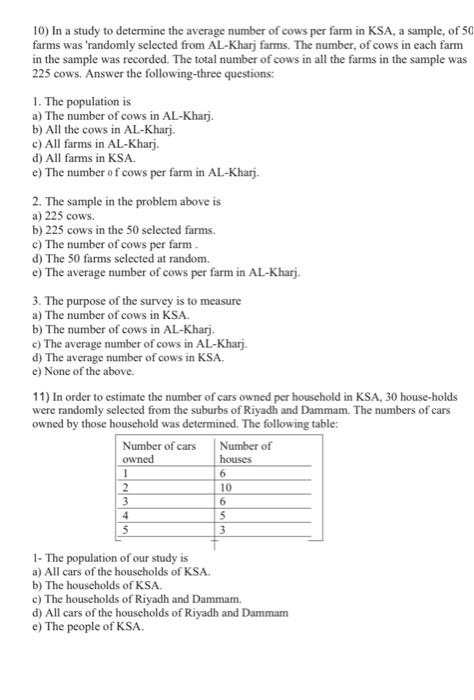
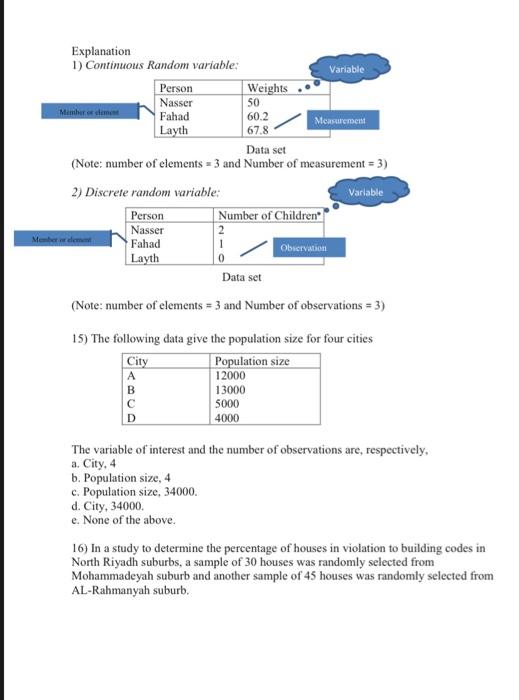
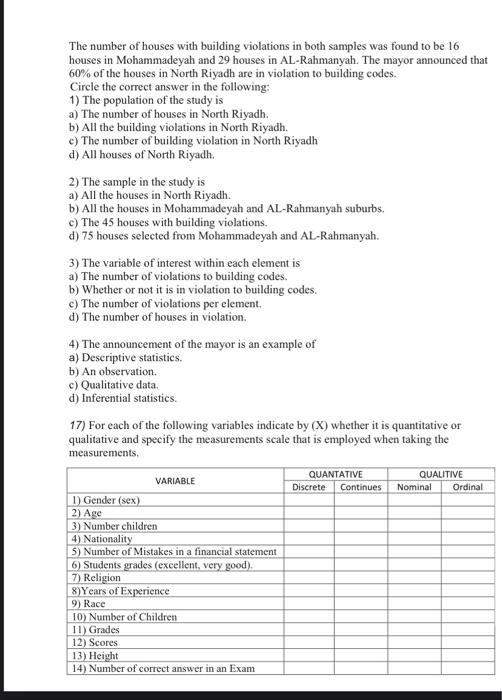
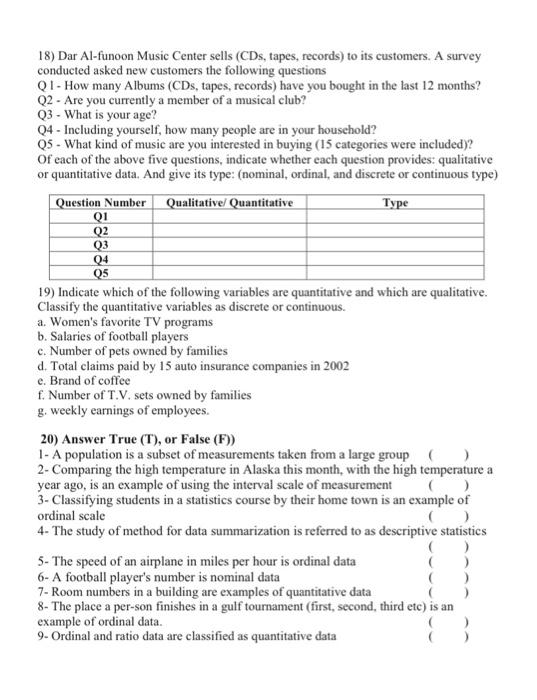
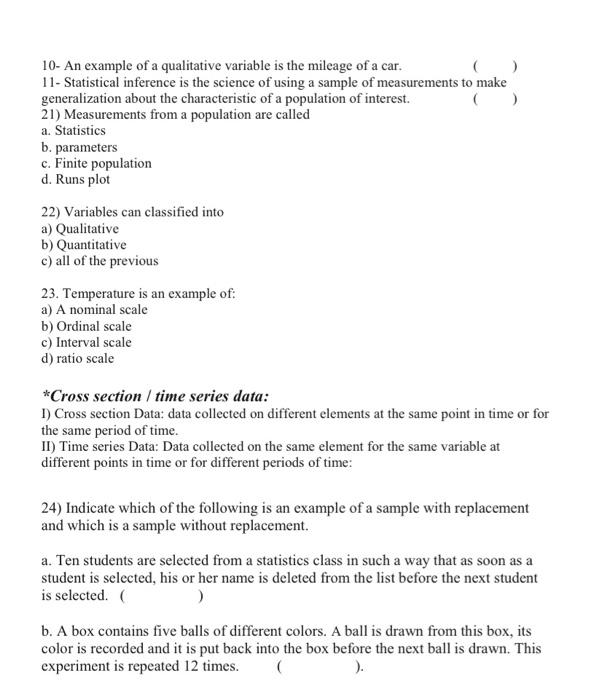
Chapter 1 Review Questions 1) The process of using sample statistics to draw conclusions about true population parameters is called A) sampling. B) the scientific method. C) statistical inference. D) descriptive statistics. 2) The goal of ---------- is to focus on summarizing and explaining a set of data A) Inferential statistics B) Descriptive statistics C) None of the above D) All of the above 3) Those methods involving the collection, presentation, and characterization of a set of data in order to describe the various features of that set of data are called. A) the scientific method B) statistical inference. C) descriptive statistics D) sampling. 4) A population in statistics means a collection of all a. men and women b. subjects or objects of interest c. people living in a country 5) A sample in statistics means a portion of the a. people selected from the population of a country b. people selected from the population of an area c. population of interest The universe or "totality of items or things" under consideration is called A) a parameter B) a statistic C) a sample. D) a population 7) A summary measure that is computed to describe a characteristic of an entire population is called A) the scientific method. B) a statistic C) a parameter. D) a census. 8) Which of the following is most likely a population as opposed to a sample? A) Respondents to a newspaper survey. B) Every third person to arrive at the bank. C) The first 5 students completing an assignment. D) Registered voters in a county. 9) A researcher at a University wishes to estimate the textbook costs of first-year students. To do so, she recorded the textbook cost of 250 first-year students and found that their average textbook cost was $300 per semester. 1- The population of interest is A) The 250 students that were recorded B) All University students C) All first-year students D) All college students. 2- The sample in the study is A) All first-year students. B) All the university students. C) The 250 students that were recorded. D) All college students. 3- The variable of interest is A) The year in school of the university students. B) The age of all university students. The cost of incidental expenses of all university students. D) The textbook cost of first-year students. 2- The sample of our study is a) All cars of the households of KSA. b) The households of KSA. c) The households of Riyadh and Dammam. d) All cars of the households of Riyadh and Dammam e) The people of Riyadh and Dammam. 13) To determine the percentage of school-age children who will join school this year. 300 households were selected at random in a small town revealed that 20% had children in school age. Answer the following: 1. What is the population of interest? (a) All children the town (b) All households in the town (c) All children in households. (d) None of the above 2. What is the sample? (a) The 300 students selected at random. (b) The 300 children selected at random. (c) The 300 households selected at random. (d) None of the above. 3. What is the parameter of interest? (a) Percentage of school age children in the sample (b) Percentage of households in the town (c) Percentage of school age children in the town (d) None of the above 4. How many students in the sample were found to in school-age? (a) 30 (b) 300 (c) 60 (d) none of the above. 14) Indicate which of the following refer to a population and which to a sample - A group of 5 employees selected from a company. - Total items produced on a machine - Yearly expenditure on clothes for 50 persons. - Number of houses sold by all 10 employees of an agency 10) In a study to determine the average number of cows per farm in KSA, a sample of 50 farms was 'randomly selected from AL-Kharj farms. The number of cows in each farm in the sample was recorded. The total number of cows in all the farms in the sample was 225 cows. Answer the following-three questions: 1. The population is a) The number of cows in AL-Kharj. b) All the cows in AL-Kharj. c) All farms in AL-Kharj. d) All farms in KSA c) The number of cows per farm in AL-Kharj. 2. The sample in the problem above is a) 225 cows. b) 225 cows in the 50 selected farms. c) The number of cows per farm d) The 50 farms selected at random. e) The average number of cows per farm in AL-Kharj. 3. The purpose of the survey is to measure a) The number of cows in KSA. b) The number of cows in AL-Kharj. c) The average number of cows in AL-Kharj. d) The average number of cows in KSA. e) None of the above 11) In order to estimate the number of cars owned per household in KSA, 30 house-holds were randomly selected from the suburbs of Riyadh and Dammam. The numbers of cars owned by those household was determined. The following table: Number of cars Number of owned houses 1 2 3 4 5 6 10 6 5 3 1- The population of our study is a) All cars of the households of KSA. b) The households of KSA. c) The households of Riyadh and Dammam, d) All cars of the households of Riyadh and Dammam e) The people of KSA. Explanation 1) Continuous Random variable: Variable Person Weights Nasser SO Member or chement Fahad 60.2 Measurement Layth 67.8 Data set (Note: number of elements = 3 and Number of measurement = 3) 2) Discrete random variable: Variable Person Number of Children Nasser 2 Fahad Observation Layth Data set (Note: number of elements = 3 and Number of observations = 3) Mehe dem 1 0 15) The following data give the population size for four cities City Population size 12000 B 13000 5000 D 4000 A The variable of interest and the number of observations are, respectively, a. City, 4 b. Population size, 4 c. Population size, 34000. d. City, 34000 e. None of the above 16) In a study to determine the percentage of houses in violation to building codes in North Riyadh suburbs, a sample of 30 houses was randomly selected from Mohammadeyah suburb and another sample of 45 houses was randomly selected from AL-Rahmanyah suburb. The number of houses with building violations in both samples was found to be 16 houses in Mohammadeyah and 29 houses in AL-Rahmanyah. The mayor announced that 60% of the houses in North Riyadh are in violation to building codes. Circle the correct answer in the following: 1) The population of the study is a) The number of houses in North Riyadh. b) All the building violations in North Riyadh. c) The number of building violation in North Riyadh d) All houses of North Riyadh. 2) The sample in the study is a) All the houses in North Riyadh. b) All the houses in Mohammadeyah and AL-Rahmanyah suburbs. c) The 45 houses with building violations. d) 75 houses selected from Mohammadeyah and AL-Rahmanyah. 3) The variable of interest within each element is a) The number of violations to building codes. b) Whether or not it is in violation to building codes. c) The number of violations per element d) The number of houses in violation. 4) The announcement of the mayor is an example of a) Descriptive statistics. b) An observation c) Qualitative data d) Inferential statistics. 17) For each of the following variables indicate by (X) whether it is quantitative or qualitative and specify the measurements scale that is employed when taking the measurements. QUANTATIVE VARIABLE Discrete Continues 1) Gender (sex) 2) Age 3) Number children 4) Nationality 5) Number of Mistakes in a financial statement 6) Students grades (excellent, very good). 7) Religion 8)Years of Experience 9) Race 10) Number of Children 11) Grades 12) Scores 13) Height 14) Number of correct answer in an Exam QUALITIVE Nominal Ordinal 18) Dar Al-funoon Music Center sells (CDs, tapes, records) to its customers. A survey conducted asked new customers the following questions Q1 - How many Albums (CDs, tapes, records) have you bought in the last 12 months? Q2 - Are you currently a member of a musical club? Q3 - What is your age? Q4 - Including yourself, how many people are in your household? Q5. What kind of music are you interested in buying (15 categories were included)? of each of the above five questions, indicate whether each question provides: qualitative or quantitative data. And give its type: (nominal, ordinal, and discrete or continuous type) Question Number Qualitative/ Quantitative Type Q1 Q3 04 19) Indicate which of the following variables are quantitative and which are qualitative. Classify the quantitative variables as discrete or continuous. a. Women's favorite TV programs b. Salaries of football players c. Number of pets owned by families d. Total claims paid by 15 auto insurance companies in 2002 e. Brand of coffee f. Number of T.V. sets owned by families g. weekly earnings of employees. 20) Answer True (T), or False (F)) 1- A population is a subset of measurements taken from a large group ( ) 2- Comparing the high temperature in Alaska this month, with the high temperature a year ago, is an example of using the interval scale of measurement ( 3- Classifying students in a statistics course by their home town is an example of ordinal scale 4- The study of method for data summarization is referred to as descriptive statistics 5- The speed of an airplane in miles per hour is ordinal data ) 6- A football player's number is nominal data ) 7- Room numbers in a building are examples of quantitative data 8- The place a per-son finishes in a gulf tournament (first, second third etc) is an example of ordinal data. 9. Ordinal and ratio data are classified as quantitative data ) 10- An example of a qualitative variable is the mileage of a car. 11- Statistical inference is the science of using a sample of measurements to make generalization about the characteristic of a population of interest. 21) Measurements from a population are called a. Statistics b. parameters c. Finite population d. Runs plot 22) Variables can classified into a) Qualitative b) Quantitative c) all of the previous 23. Temperature is an example of: a) A nominal scale b) Ordinal scale c) Interval scale d) ratio scale *Cross section / time series data: 1) Cross section Data: data collected on different elements at the same point in time or for the same period of time. II) Time series Data: Data collected on the same element for the same variable at different points in time or for different periods of time: 24) Indicate which of the following is an example of a sample with replacement and which is a sample without replacement. a. Ten students are selected from a statistics class in such a way that as soon as a student is selected, his or her name is deleted from the list before the next student is selected.( b. A box contains five balls of different colors. A ball is drawn from this box, its color is recorded and it is put back into the box before the next ball is drawn. This experiment is repeated 12 times