

Question: Chapter 1, Section 1.1, EXERCISES, Exercise 50 Page 60 Exercises 45 to 48 refer to the following graph, which shows the number f (t) of
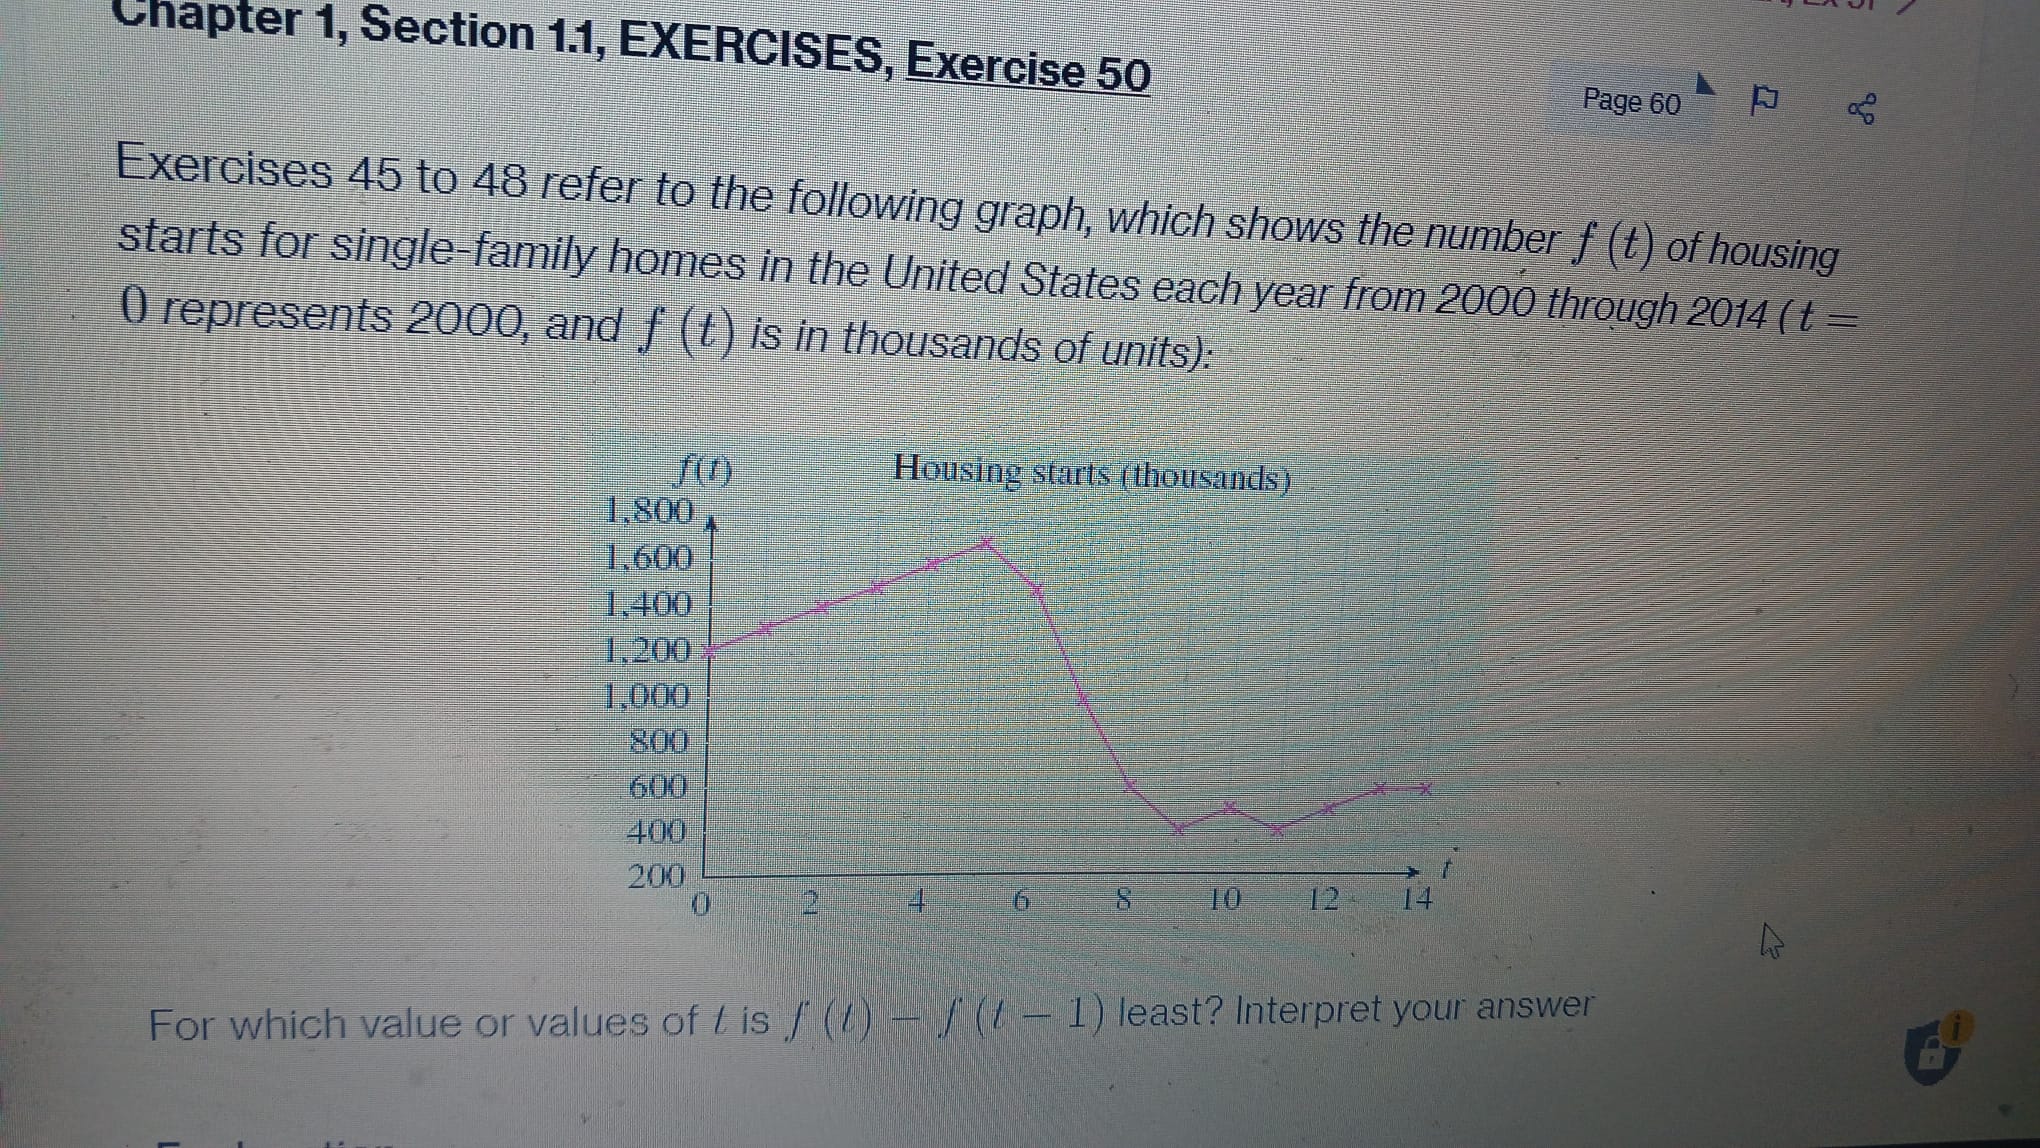
Chapter 1, Section 1.1, EXERCISES, Exercise 50 Page 60 Exercises 45 to 48 refer to the following graph, which shows the number f (t) of housing starts for single-family homes in the United States each year from 2000 through 2014 ( t = 0 represents 2000, and f (t) is in thousands of units): Housing starts (thousands) 1.800 1.600 1.400 1.200 1,000 800 600 400 200 6 8 10 12 14 For which value or values of t is / (1 ) - / (1 - 1) least? Interpret your
Step by Step Solution
There are 3 Steps involved in it
1 Expert Approved Answer
Step: 1 Unlock

Question Has Been Solved by an Expert!
Get step-by-step solutions from verified subject matter experts
Step: 2 Unlock
Step: 3 Unlock