

Question: Chapter 10, Problem 14 The file P02_12.xlsx includes data on the 50 top graduate programs in the United States, according to a recent U.S. News
Chapter 10, Problem 14
The file P02_12.xlsx includes data on the 50 top graduate programs in the United States, according to a recent U.S. News & World Report survey. Columns B, C, and D contain ratings: an overall rating, a rating by peer schools, and a rating by recruiters. The other columns contain data that might be related to these ratings.
A.Find a table of correlations between all of the numerical variables. From these correlations, which variables in columns E-L are most highly correlated with the various ratings?
B.For the Overall rating, run a regression using it as the dependent variable and the variable (from columns E-L) most highly correlated with it. Interpret this equation. Could you have guessed the value of R2 before running the regression? Explain. What does the standard error of estimate indicate?
C.Repeat part b with the Peers ratings as the dependent variable. Repeat again with the Recruiters rating as the dependent variable. Discuss any differences among the three regressions in part b and c.
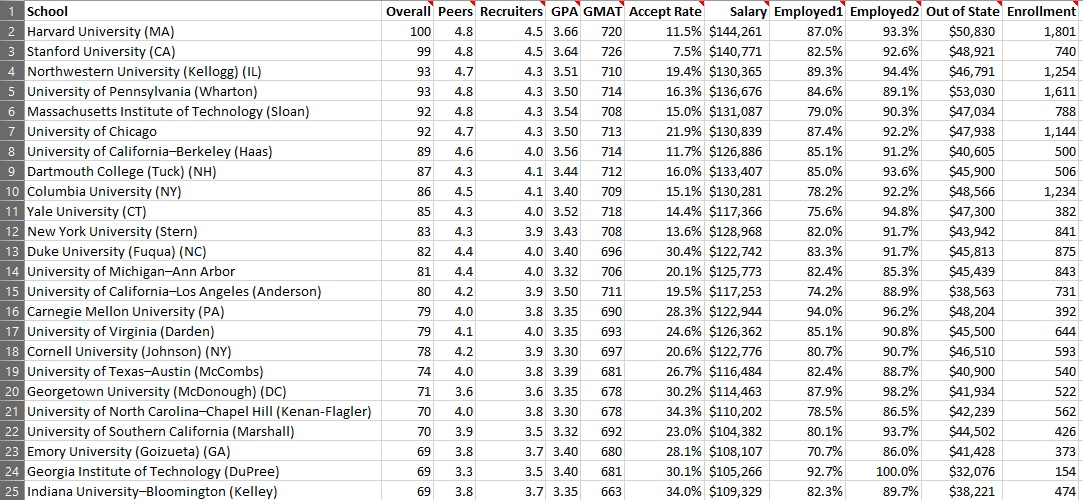
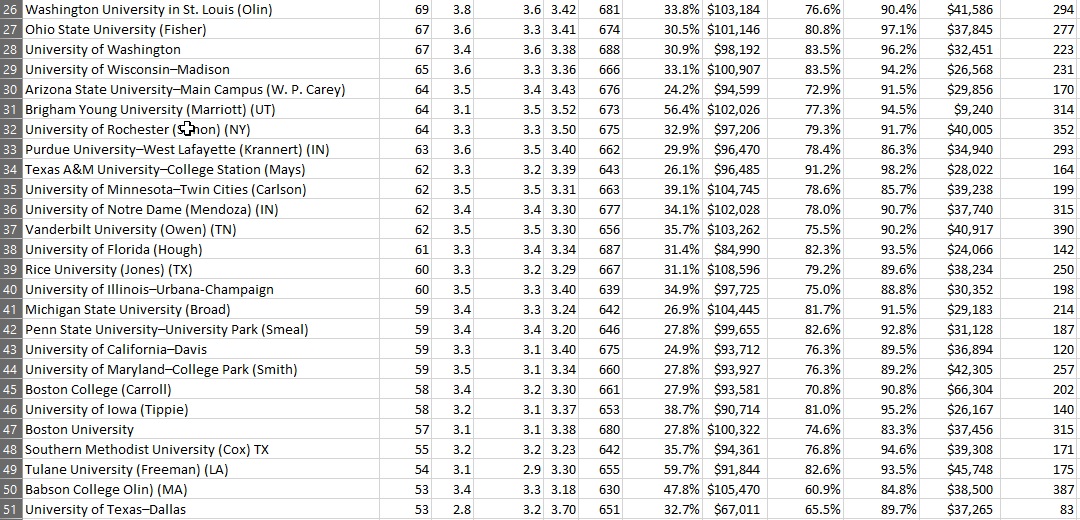
School Overall Peers Recruiters GPA GMAT Accept Rate Salary Employed1 Employed2 Out of State Enrollment 2 Harvard University (MA) 100 4.8 4.5 3.66 720 11.5% $144,261 87.0% 93.3% $50,830 1,801 3 Stanford University (CA) 99 4.8 4.5 3.64 726 7.5% $140,771 82.5% 92.6% $48,921 740 4 Northwestern University (Kellogg) (IL) 93 4.7 4.3 3.51 710 19.4% $130,365 89.3% 94.4% $46,791 1,254 5 University of Pennsylvania (Wharton) 93 4.8 4.3 3.50 714 16.3% $136,676 84.6% 89.1% $53,030 1,611 6 Massachusetts Institute of Technology (Sloan) 92 4.8 4.3 3.54 708 15.0% $131,087 79.0% 90.3% $47,034 788 University of Chicago 92 4.7 4.3 3.50 713 21.9% $130,839 87.4% 92.2% $47,938 1,144 8 University of California-Berkeley (Haas) 89 4.6 4.0 3.56 714 11.7% $126,886 85.1% 91.2% $40,605 500 9 Dartmouth College (Tuck) (NH) 87 4.3 4.1 3.44 712 16.0% $133,407 85.0% 93.6% $45,900 506 10 Columbia University (NY) 86 4.5 4.1 3.40 709 15.1% $130,281 78.2% 92.2% $48,566 1,234 Yale University (CT) 85 4.3 4.0 3.52 718 14.4% $117,366 75.6% 94.8% $47,300 382 12 New York University (Stern) 83 4.3 3.9 3.43 708 13.6% $128,968 82.0% 91.7% $43,942 841 13 Duke University (Fuqua) (NC) 82 4.4 4.0 3.40 696 30.4% $122,742 83.3% 91.7% $45,813 875 14 University of Michigan-Ann Arbor 81 4.4 4.0 3.32 706 20.1% $125,773 82.4% 85.3% $45,439 843 15 University of California-Los Angeles (Anderson) 80 4.2 3.9 3.50 711 19.5% $117,253 74.2% 88.9% $38,563 731 16 Carnegie Mellon University (PA) 79 4.0 3.8 3.35 690 28.3% $122,944 94.0% 96.2% $48,204 392 17 University of Virginia (Darden) 79 4.1 4.0 3.35 693 24.6% $126,362 85.1% 90.8% $45,500 644 18 Cornell University (Johnson) (NY) 78 4.2 3.9 3.30 697 20.6% $122,776 80.7% 90.7% $46,510 593 19 University of Texas-Austin (Mccombs) 74 4.0 3.8 3.39 681 26.7% $116,484 82.4% 88.7% $40,900 540 20 Georgetown University (McDonough) (DC) 71 3.6 3.6 3.35 678 30.2% $114,463 87.9% 98.2% $41,934 522 21 University of North Carolina-Chapel Hill (Kenan-Flagler) 70 4.0 3.8 3.30 678 34.3% $110,202 78.5% 86.5% $42,239 562 22 University of Southern California (Marshall) 70 3.9 3.5 3.32 692 23.0% $104,382 80.1% 93.7% $44,502 426 23 Emory University (Goizueta) (GA) 69 3.8 3.7 3.40 680 28.1% $108,107 70.7% 86.0% $41,428 373 24 Georgia Institute of Technology (Dupree) 69 3.3 3.5 3.40 681 30.1% $105,266 92.7% 100.0% $32,076 154 25 Indiana University-Bloomington (Kelley) 69 3.8 3.7 3.35 663 34.0% $109,329 82.3% 89.7% $38,221 474\f
Step by Step Solution
There are 3 Steps involved in it

Get step-by-step solutions from verified subject matter experts