

Question: Chapter 10, Problem 1MC - Reformulated Income Statement / Gains on Asset sales To calculate the Gains on Asset sales I use the following
Chapter 10, Problem 1MC - Reformulated Income Statement / Gains on Asset sales
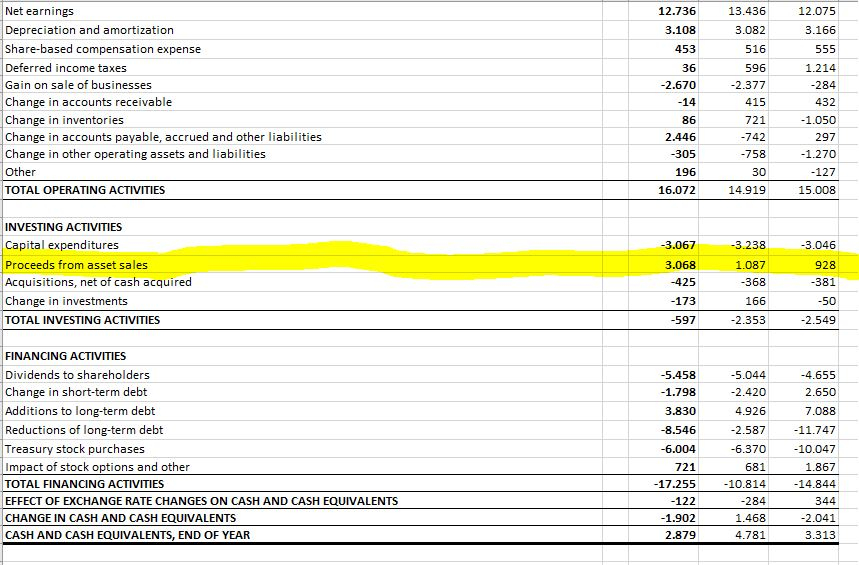
To calculate the "Gains on Asset sales" I use the following formula:
"sales proceeds" minus "book value of assets"
- In the Cash Flow statement I can find the "sales proceeds", which is 3'068
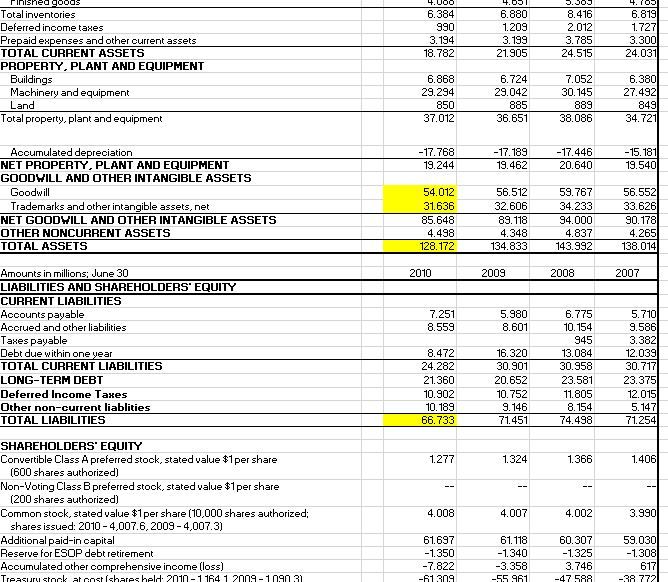
- book value of the assets should be total assets (128'172) minus intangible assets (patents/goodwill, 85'648) minus liabilities (66'733) This would result in a total of: 3'068 - 24'209 --> this is nothing close to the solution of 70. Where am I doing wrong? What amounts/positions do I have to include or exclude? Thank you!
Cash Flow Statement:
Balance Sheet
Solutions from Chegg:
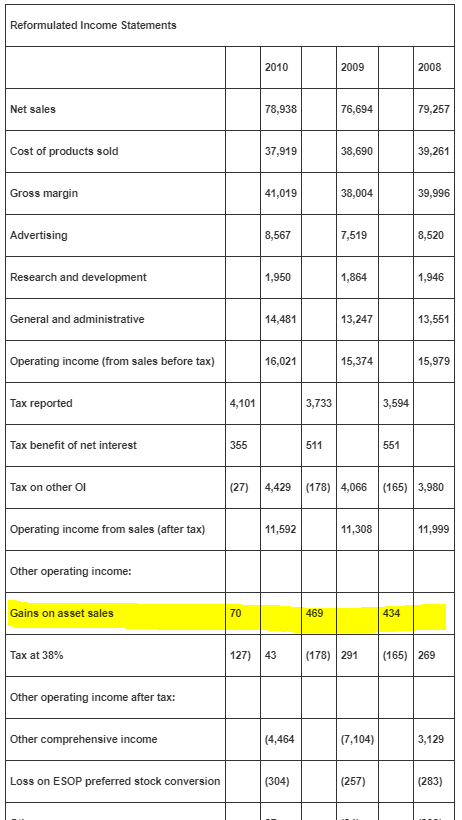
13.436 3.082 516 596 2.377 415 721 742 758 30 14.919 Net earnings Depreciation and amortization Share-based compensation expense Deferred income taxes Gain on sale of businesses Change in accounts receivable Change in inventories Change in accounts payable, accrued and other liabilities Change in other operating assets and liabilities Other TOTAL OPERATING ACTIVITIES 12.736 3.108 453 36 2.670 12.075 3.166 284 432 1.050 297 1.270 127 15.008 86 2.446 305 196 16.072 INVESTING ACTIVITIES Capital expenditures Proceeds from asset sales Acquisitions, net of cash acquired Change in investments TOTAL INVESTING ACTIVITIES 3.238 1.087 368 166 2.353 3.067 3.068 -425 173 597 3.046 928 381 50 2.549 FINANCING ACTIVITIES Dividends to shareholders Change in short-term debt Additions to long-term debt Reductions of long-term debt Treasury stock purchases Impact of stock options and other TOTAL FINANCING ACTIVITIES EFFECT OF EXCHANGE RATE CHANGES ON CASH AND CASH EQUIVALENTS CHANGE IN CASH AND CASH EQUIVALENTS CASH AND CASH EQUIVALENTS, END OF YEAR 5.044 2.420 4.926 2.587 -6.370 681 10.814 284 1.468 4.781 -4.655 2.650 7.088 11.747 10.047 1.867 14.844 344 2.041 3.313 5.458 1.798 3.830 -8.546 -6.004 721 17.255 122 1.902 2.879 6.880 1.209 Total inventories Deferred income taxes Prepaid epenses and other current assets TOTAL CURRENT ASSETS PROPERTY, PLANT AND EQUIPMENT 1.727 18.782 21.905 6.868 29.294 850 6.380 27.492 Buildings Machinery and equipment 29.042 885 36.651 889 38.086 Total property, plant and equipment Accumulated depreciation NET PROPERTY. PLANT AND EQUIPMENT GOODWILL AND OTHER INTANGIBLE ASSETS 17.189 17.446 20.640 19.244 19.540 59.767 34.233 Goodwill 56.552 33.626 Trademarks and other intangible assets, net NET GOODWILL AND OTHER INTANGIBLE ASSETS OTHER NONCURRENT ASSETS TOTAL ASSETS 31.636 85.648 4.498 128 32.606 4.348 4.837 143.992 4.265 Amounts in millions; June 30 LIABILITIES AND SHAREHOLDERS EQUITY CURRENT LIABILITIES 2009 2008 2007 9.586 3.382 12.039 Accrued and other liabilities Taxes payable Debt due within one year TOTAL CURRENT LIABILITIES LONG-TERM DEBT Deferred Income Taes Other non-current liablities TOTAL LIABILITIES 8.559 8.601 10.154 945 13.084 30.958 23.581 11.805 8.472 24.282 21.360 10.902 10.189 16.320 30.901 10.752 1451 23.375 5.147 71.254 4.498 SHAREHOLDERS' EQUITY Convertible Class A preferred stock, stated value $1per share 1.406 1.366 (600 shares authorized) Non-Voting Class B preferred stock, stated value $1per share (200 shares authorized) Common stock, stated value $1 per share(10,000 shares authorized; 4.008 3.990 shares issued: 2010 4,007.6, 2009 4,007.3) Additional paid-in capital Reserue for ESOP debt retirement Accumulated other comprehensive income (loss) 61.697 60.307 59.030 -1308 1.340 3.746 47 50 010-1 164 1 2009-1090 3 55961 Reformulated Income Statements 2010 2009 2008 Net saless 78,938 76,694 79,257 Cost of products sold 37,919 38,690 39,261 41,019 Gross margin 38,004 39.996 Advertising 8,567 7,519 8,520 1,864 1,946 Research and development 1,950 General and administrative 14,481 13,247 13,551 Operating income (from sales before tax) 16,021 15,374 15,979 Tax reported 4,101 3,733 3,594 Tax benefit of net interest 355 511 551 Tax on other Ol (27) 4,429 (178) 4,066 (165) 3,980 11,592 Operating income from sales (after tax) 11,308 11,999 Other operating income: Gains on asset sales 70 469 434 (178)291 (165) 269 Tax at 38% Other operating income after tax: (4,464 Other comprehensive income (7,104) 3,129 (304) (283) (257) Loss on ESOP preferred stock conversion 13.436 3.082 516 596 2.377 415 721 742 758 30 14.919 Net earnings Depreciation and amortization Share-based compensation expense Deferred income taxes Gain on sale of businesses Change in accounts receivable Change in inventories Change in accounts payable, accrued and other liabilities Change in other operating assets and liabilities Other TOTAL OPERATING ACTIVITIES 12.736 3.108 453 36 2.670 12.075 3.166 284 432 1.050 297 1.270 127 15.008 86 2.446 305 196 16.072 INVESTING ACTIVITIES Capital expenditures Proceeds from asset sales Acquisitions, net of cash acquired Change in investments TOTAL INVESTING ACTIVITIES 3.238 1.087 368 166 2.353 3.067 3.068 -425 173 597 3.046 928 381 50 2.549 FINANCING ACTIVITIES Dividends to shareholders Change in short-term debt Additions to long-term debt Reductions of long-term debt Treasury stock purchases Impact of stock options and other TOTAL FINANCING ACTIVITIES EFFECT OF EXCHANGE RATE CHANGES ON CASH AND CASH EQUIVALENTS CHANGE IN CASH AND CASH EQUIVALENTS CASH AND CASH EQUIVALENTS, END OF YEAR 5.044 2.420 4.926 2.587 -6.370 681 10.814 284 1.468 4.781 -4.655 2.650 7.088 11.747 10.047 1.867 14.844 344 2.041 3.313 5.458 1.798 3.830 -8.546 -6.004 721 17.255 122 1.902 2.879 6.880 1.209 Total inventories Deferred income taxes Prepaid epenses and other current assets TOTAL CURRENT ASSETS PROPERTY, PLANT AND EQUIPMENT 1.727 18.782 21.905 6.868 29.294 850 6.380 27.492 Buildings Machinery and equipment 29.042 885 36.651 889 38.086 Total property, plant and equipment Accumulated depreciation NET PROPERTY. PLANT AND EQUIPMENT GOODWILL AND OTHER INTANGIBLE ASSETS 17.189 17.446 20.640 19.244 19.540 59.767 34.233 Goodwill 56.552 33.626 Trademarks and other intangible assets, net NET GOODWILL AND OTHER INTANGIBLE ASSETS OTHER NONCURRENT ASSETS TOTAL ASSETS 31.636 85.648 4.498 128 32.606 4.348 4.837 143.992 4.265 Amounts in millions; June 30 LIABILITIES AND SHAREHOLDERS EQUITY CURRENT LIABILITIES 2009 2008 2007 9.586 3.382 12.039 Accrued and other liabilities Taxes payable Debt due within one year TOTAL CURRENT LIABILITIES LONG-TERM DEBT Deferred Income Taes Other non-current liablities TOTAL LIABILITIES 8.559 8.601 10.154 945 13.084 30.958 23.581 11.805 8.472 24.282 21.360 10.902 10.189 16.320 30.901 10.752 1451 23.375 5.147 71.254 4.498 SHAREHOLDERS' EQUITY Convertible Class A preferred stock, stated value $1per share 1.406 1.366 (600 shares authorized) Non-Voting Class B preferred stock, stated value $1per share (200 shares authorized) Common stock, stated value $1 per share(10,000 shares authorized; 4.008 3.990 shares issued: 2010 4,007.6, 2009 4,007.3) Additional paid-in capital Reserue for ESOP debt retirement Accumulated other comprehensive income (loss) 61.697 60.307 59.030 -1308 1.340 3.746 47 50 010-1 164 1 2009-1090 3 55961 Reformulated Income Statements 2010 2009 2008 Net saless 78,938 76,694 79,257 Cost of products sold 37,919 38,690 39,261 41,019 Gross margin 38,004 39.996 Advertising 8,567 7,519 8,520 1,864 1,946 Research and development 1,950 General and administrative 14,481 13,247 13,551 Operating income (from sales before tax) 16,021 15,374 15,979 Tax reported 4,101 3,733 3,594 Tax benefit of net interest 355 511 551 Tax on other Ol (27) 4,429 (178) 4,066 (165) 3,980 11,592 Operating income from sales (after tax) 11,308 11,999 Other operating income: Gains on asset sales 70 469 434 (178)291 (165) 269 Tax at 38% Other operating income after tax: (4,464 Other comprehensive income (7,104) 3,129 (304) (283) (257) Loss on ESOP preferred stock conversion
Step by Step Solution
There are 3 Steps involved in it

Get step-by-step solutions from verified subject matter experts