

Question: Chapter 10.3 Exercise Question 14 Crickets Consider the following two scatterplots based on data gathered in a study of 30' crickets, with temperature measured in
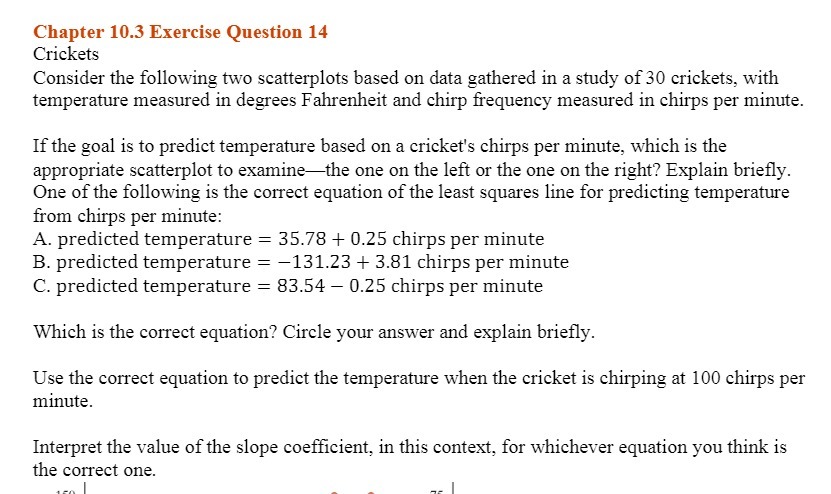
Chapter 10.3 Exercise Question 14 Crickets Consider the following two scatterplots based on data gathered in a study of 30' crickets, with temperature measured in degrees Fahrenheit and chirp 'equency measured in chirps per minute. If the goal is to predict temperature based on a cricket's chirps per minute, which is the appropriate scatterplot to examinethe one on the left or the one on the right? Explain briey. One of the following is the correct equation of the least squares line for predicting temperature from chirps per minute: A. predicted temperature = 35.?3 + 0.25 chirps per minute B. predicted temperature : 131.23 + 3.81 ehirps per minute C. predicted temperature = 83.54 [125 chirps per minute 'Which is the correct equation? Circle your answer and explain briey. Use the correct equation to predict the temperature when the cricket is chirping at 10C! chirps per minute. Interpret the value of the slope coefficient, in this context, for whichever equation you think is the correct one. m. | - _ F... |
Step by Step Solution
There are 3 Steps involved in it

Get step-by-step solutions from verified subject matter experts