

Question: Chapter 10.3 Exercise Question 19 Honda Civic pricing The data in the file UsedHondaCivics come from a sample of used Honda Civics listed for sale
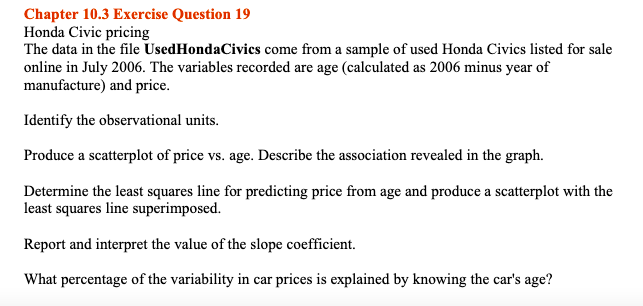
Chapter 10.3 Exercise Question 19 Honda Civic pricing The data in the file UsedHondaCivics come from a sample of used Honda Civics listed for sale online in July 2006. The variables recorded are age (calculated as 2006 minus year of manufacture) and price. Identify the observational units. Produce a scatterplot of price vs. age. Describe the association revealed in the graph. Determine the least squares line for predicting price from age and produce a scatterplot with the least squares line superimposed. Report and interpret the value of the slope coefficient. What percentage of the variability in car prices is explained by knowing the car's age
Step by Step Solution
There are 3 Steps involved in it
1 Expert Approved Answer
Step: 1 Unlock

Question Has Been Solved by an Expert!
Get step-by-step solutions from verified subject matter experts
Step: 2 Unlock
Step: 3 Unlock