

Question: Chapter 11 Multiple Choice 1. A Cox proportional hazards model is estimated relating time to psychiatric hospitalization in patients with severe mental illness. The risk


![never developed the event of interest would like] lead to which of](https://s3.amazonaws.com/si.experts.images/answers/2024/06/6673f44cc9e2e_2126673f44c9f960.jpg)
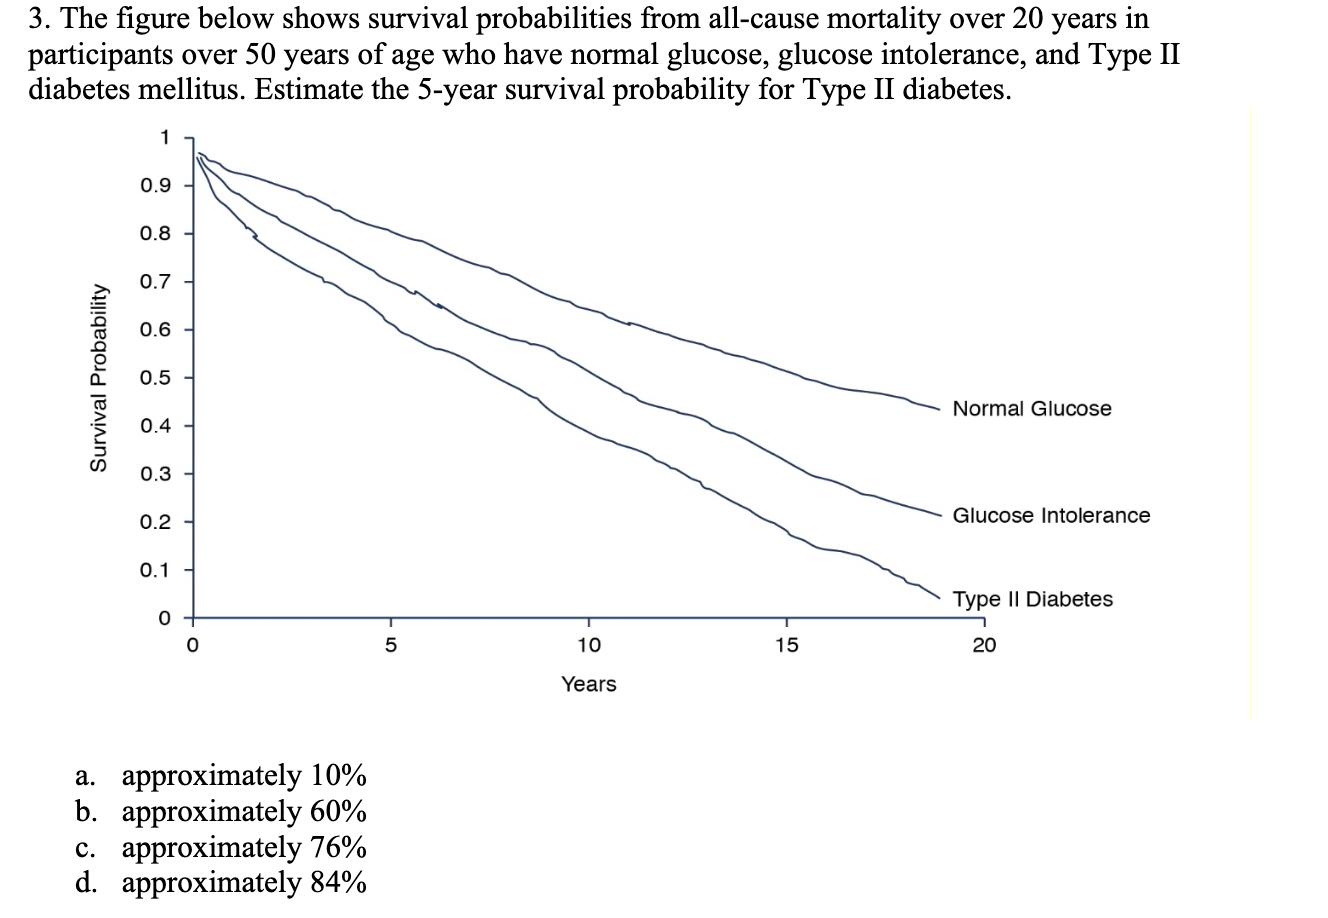
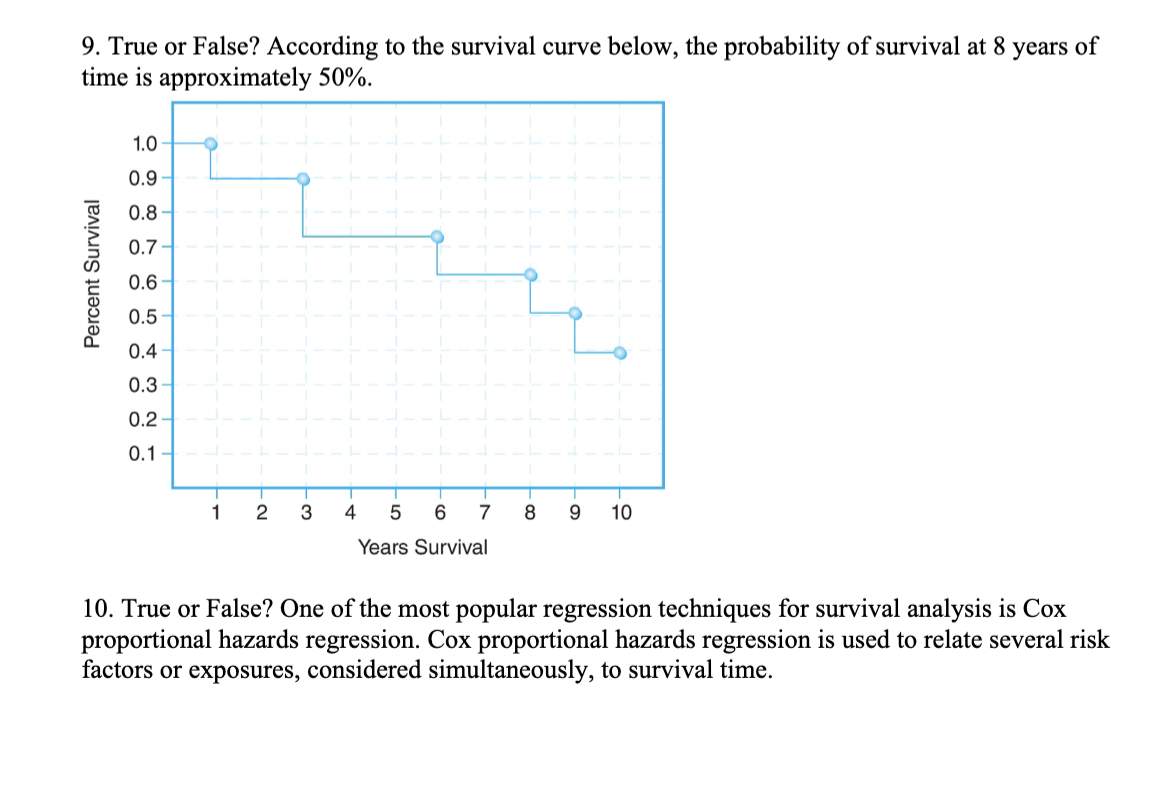
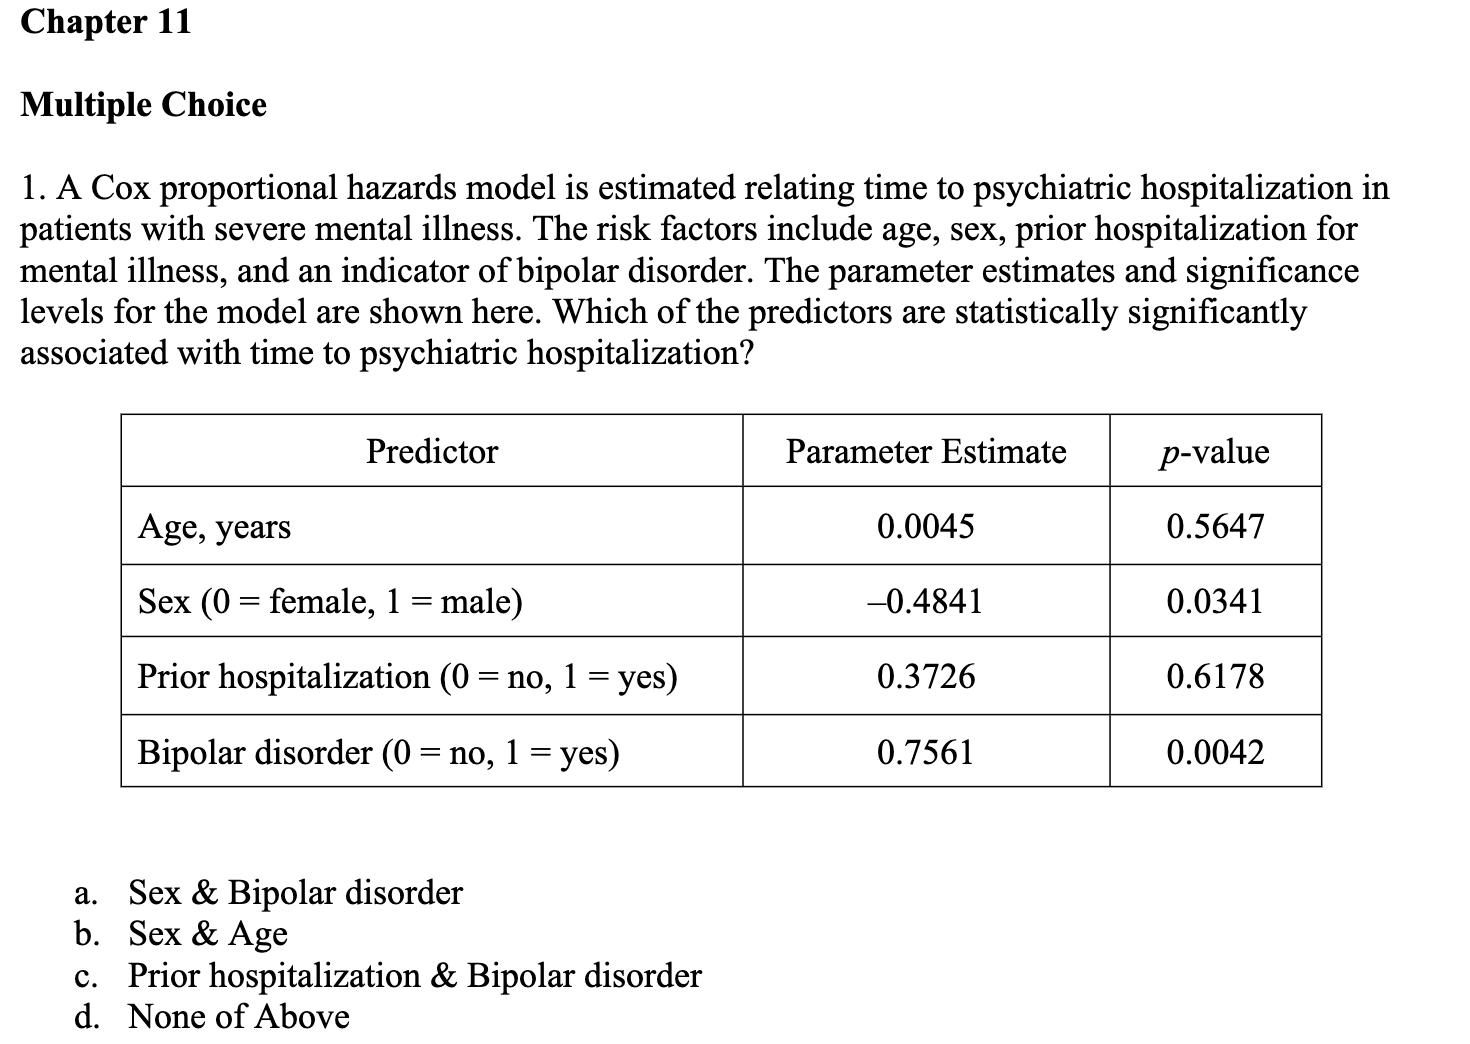
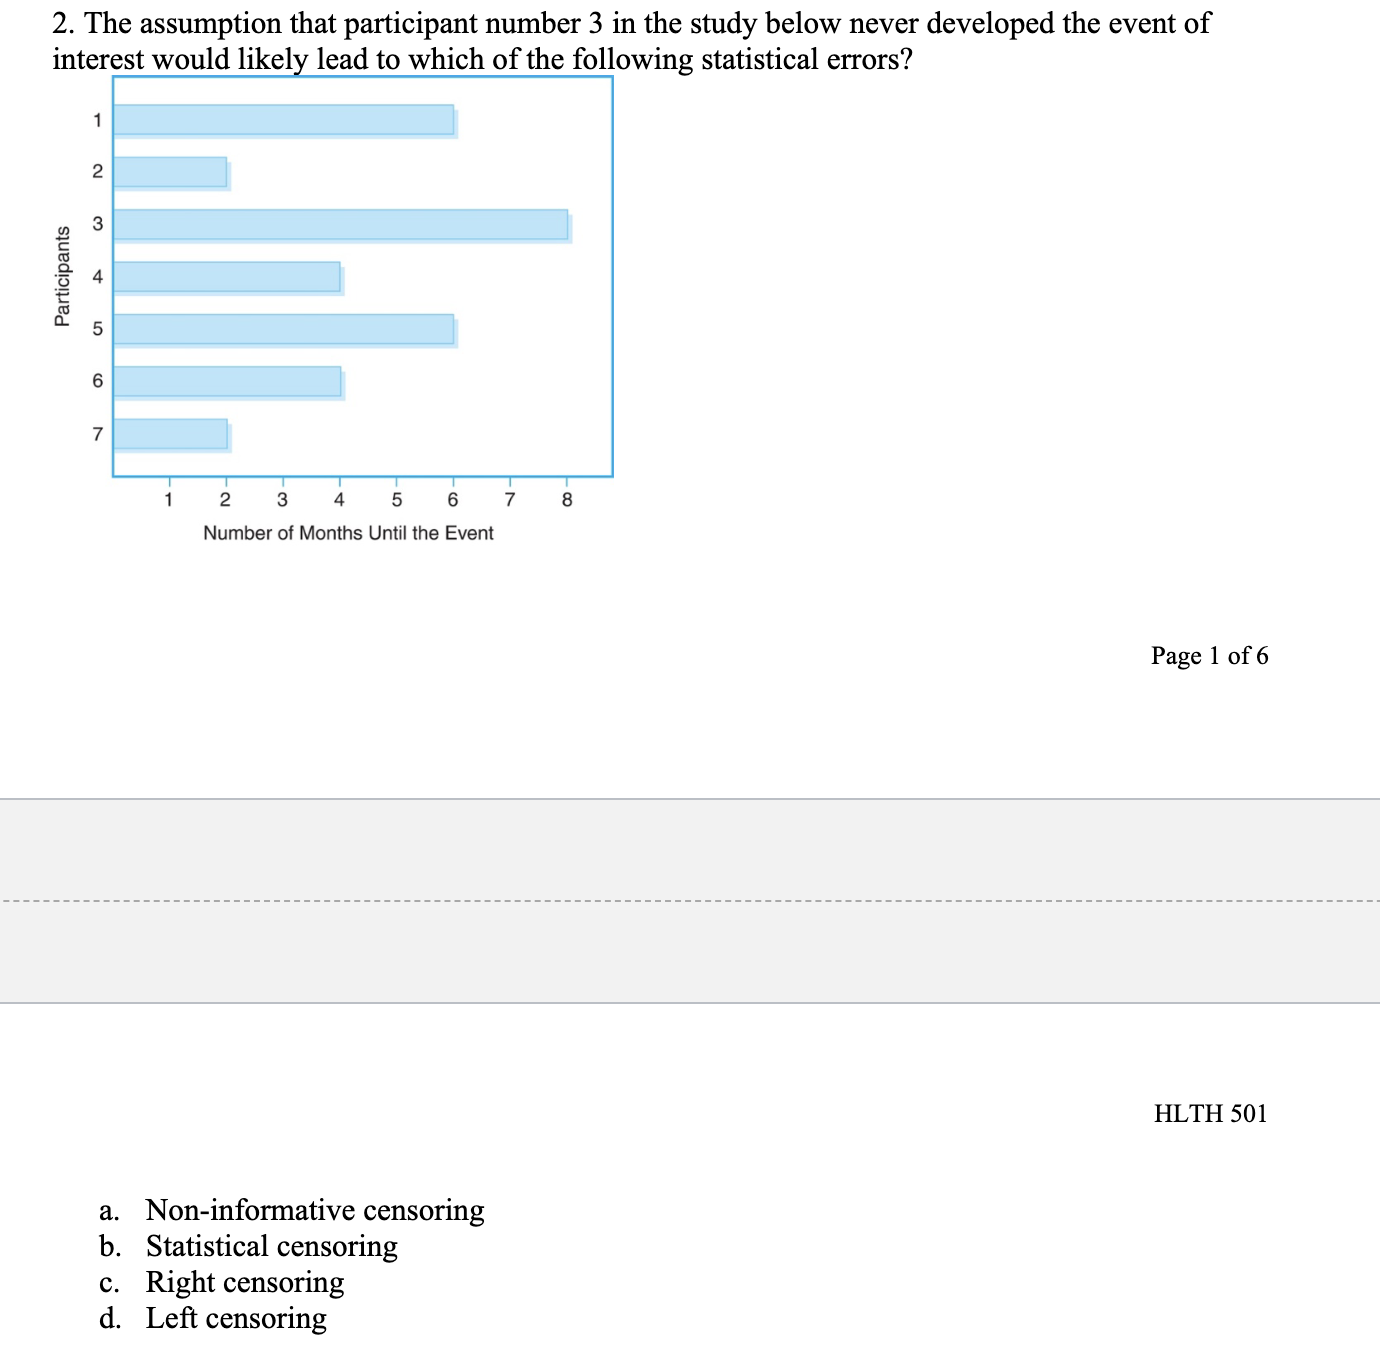
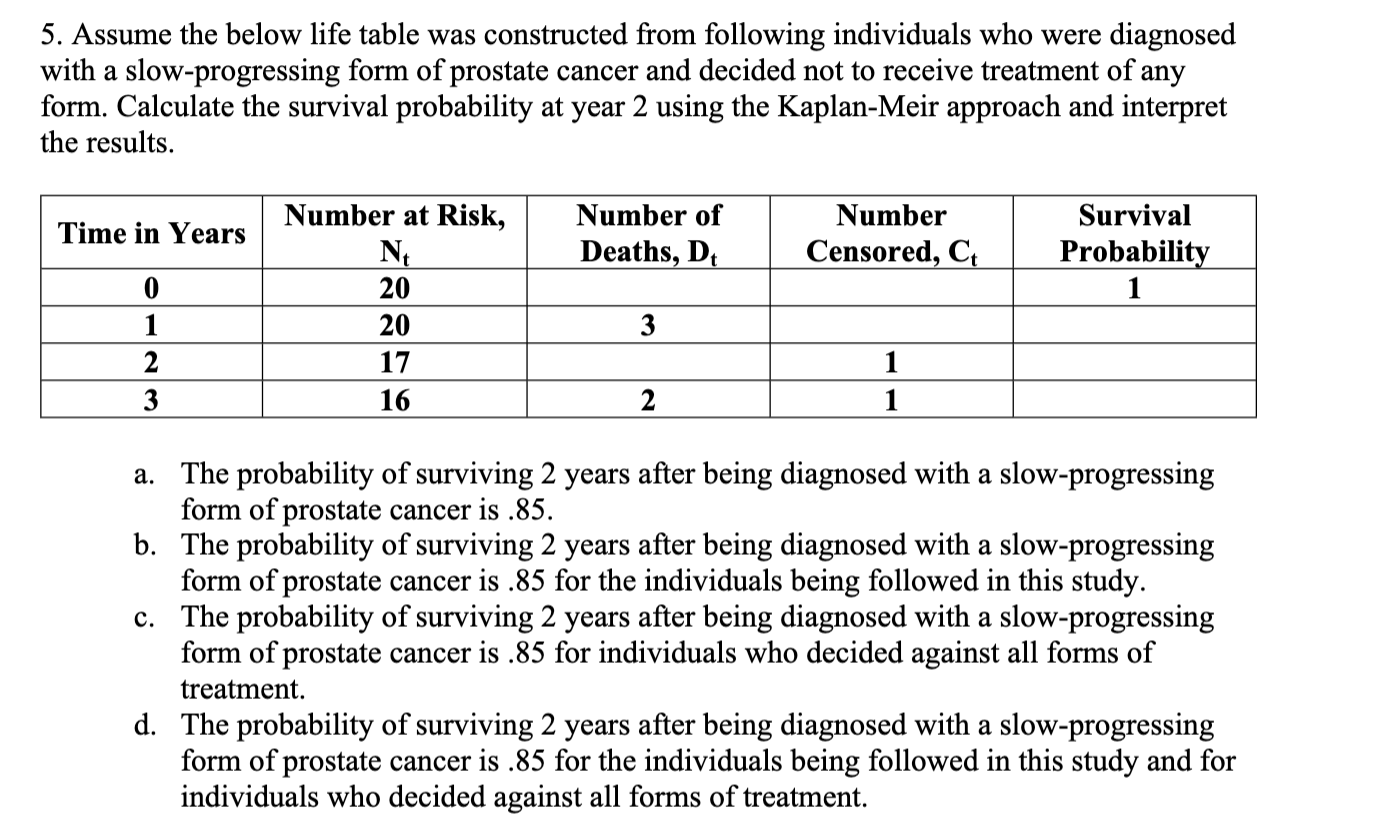
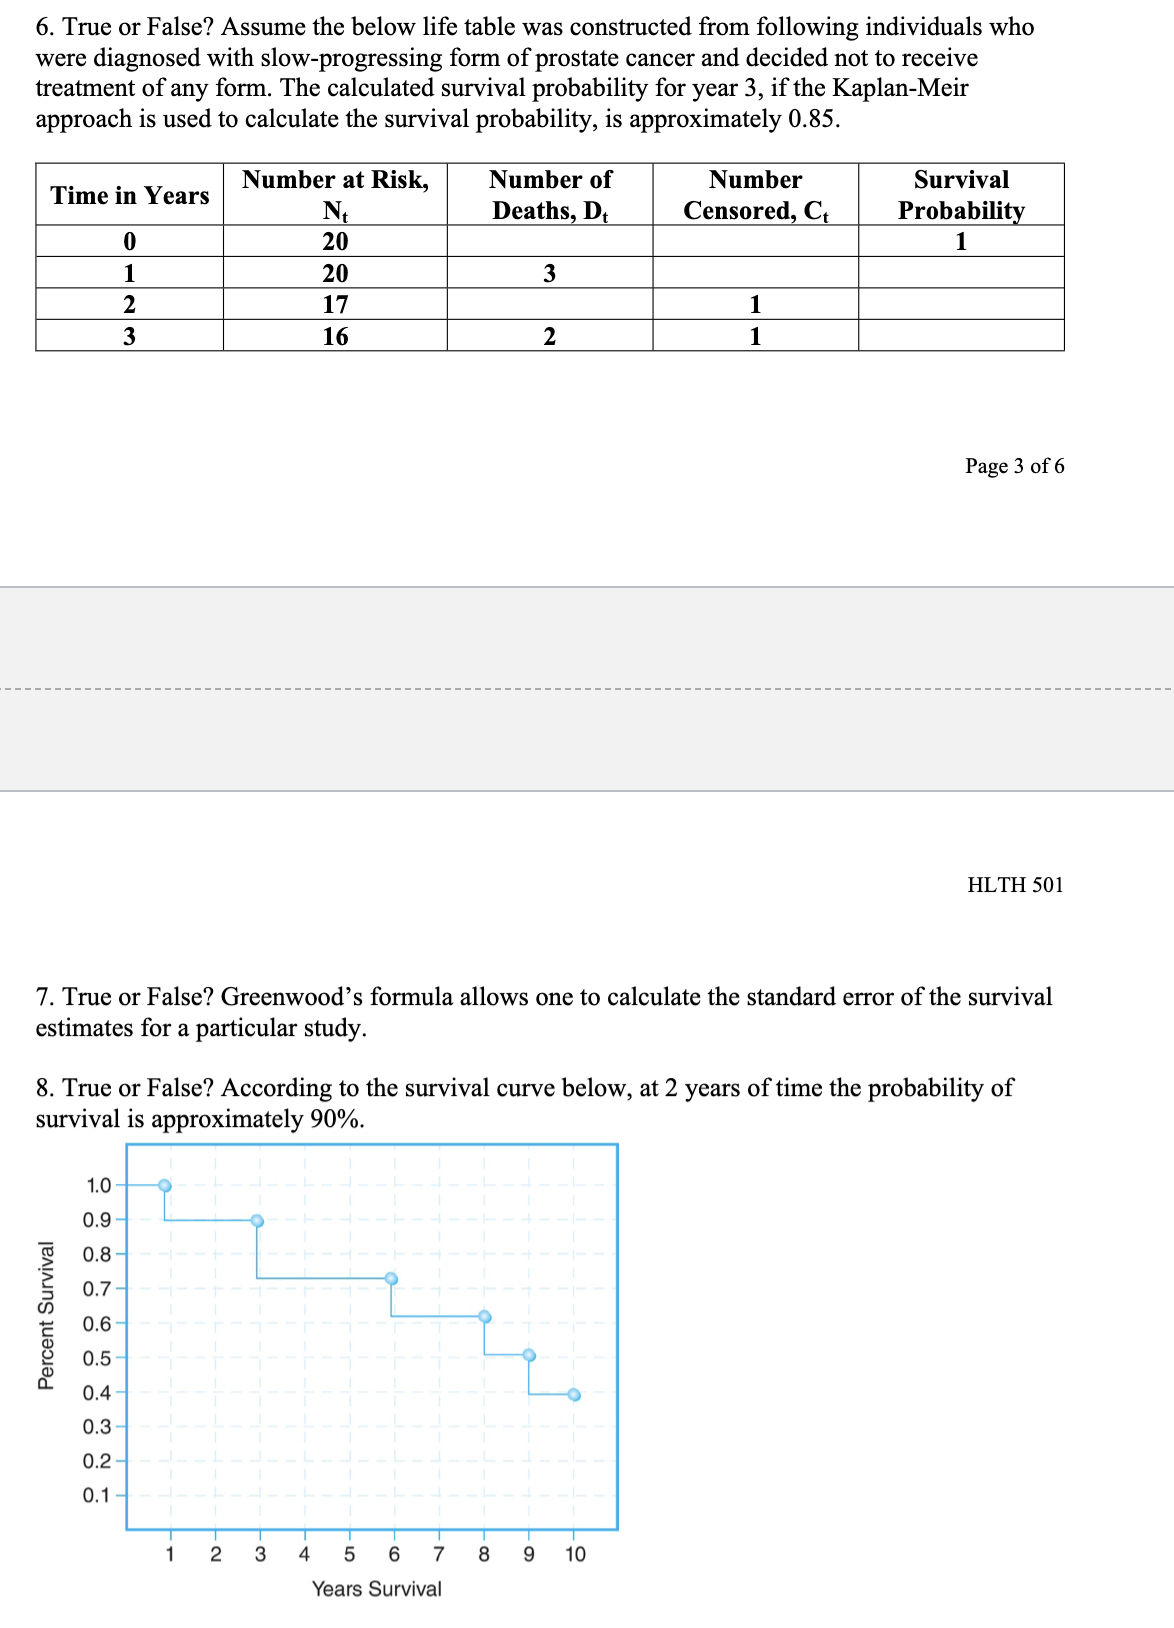
Chapter 11 Multiple Choice 1. A Cox proportional hazards model is estimated relating time to psychiatric hospitalization in patients with severe mental illness. The risk factors include age, sex, prior hospitalization for mental illness, and an indicator of bipolar disorder. The parameter estimates and significance levels for the model are shown here. Which of the predictors are statistically significantly associated with time to psychiatric hospitalization? Predictor Parameter Estimate p-value Age, years 0.0045 0.5647 Sex (0 = female, 1 = male) -0.4841 0.0341 Prior hospitalization (0 = no, 1 = yes) 0.3726 0.6178 Bipolar disorder (0 = no, 1 = yes) 0.7561 0.0042 a. Sex & Bipolar disorder b. Sex & Age c. Prior hospitalization & Bipolar disorder d. None of Above2. The assumption that participant number 3 in the study below never developed the event of interest would like] lead to which of the following statistical errors? Participants 1 2 3 4 5 6 7 8 Number of Months Until the Event Page 1 of 6 HLTH 501 a. Non-informative censoring b. Statistical censoring c. Right censoring d. Left censoring 3. The gure below shows survival probabilities from all-cause mortality over 20 years in participants over 50 years of age who have normal glucose, glucose intolerance, and Type II diabetes mellitus. Estimate the 5-year survival probability for Type II diabetes. Survival Probability 9.09\"?\" 1 0.9 0.8 0.7 0.6 0.5 0.4 0.3 0.2 0.1 0 0 approximately 10% approximately 60% approximately 76% approximately 84% Normal Glucose Glucose Intolerance Type II Diabetes 10 15 20 Years 5. Assume the below life table was constructed from following individuals who were diagnosed with a slow-progressing form of prostate cancer and decided not to receive treatment of any form. Calculate the survival probability at year 2 using the Kaplan-Meir approach and interpret the results. Time in Years Number at Risk, Number of Number Survival N Deaths D Censored C Probabili m_- -- --_-- a. The probability of surviving 2 years after being diagnosed with a slow-progressing form of prostate cancer is .85. b. The probability of surviving 2 years after being diagnosed with a slow-progressing form of prostate cancer is .85 for the individuals being followed in this study. 0. The probability of surviving 2 years after being diagnosed with a slow-progressing form of prostate cancer is .85 for individuals who decided against all forms of treatment. d. The probability of surviving 2 years after being diagnosed with a slow-progressing form of prostate cancer is .85 for the individuals being followed in this study and for individuals who decided against all forms of treatment. 6. True or False? Assume the below life table was constructed from following individuals who were diagnosed with slow-progressing form of prostate cancer and decided not to receive treatment of any form. The calculated survival probability for year 3, if the Kaplan-Meir approach is used to calculate the survival probability, is approximately 0.85. Time in Years Number at Risk, Number of Number Survival N Deaths, Dt Censored, Ct Probability 0 20 20 3 W NG 17 16 2 Page 3 of 6 HLTH 501 7. True or False? Greenwood's formula allows one to calculate the standard error of the survival estimates for a particular study. 8. True or False? According to the survival curve below, at 2 years of time the probability of survival is approximately 90%. 1.0 0.9 0.8 0.7 Percent Survival 0 .6 0.5 0.4 .3 0.1 2 3 4 5 6 7 8 9 10 Years Survival9. True or False? According to the survival curve below, the probability of survival at 8 years of time is approximately 50%. Percent Survival 1 2 3 4 5 6 7 8 9 10 YeareSurvival 10. True or False? One of the most popular regression techniques for survival analysis is Cox proportional hazards regression. Cox proportional hazards regression is used to relate several risk factors or exposures, considered simultaneously, to survival time
Step by Step Solution
There are 3 Steps involved in it

Get step-by-step solutions from verified subject matter experts