

Question: Chapter 12 - Q5 (NEW): Please answer the questions in full as seen in the photos below: Data Table Below: The following table contains monthly
Chapter 12 - Q5 (NEW): Please answer the questions in full as seen in the photos below:
Data Table Below:
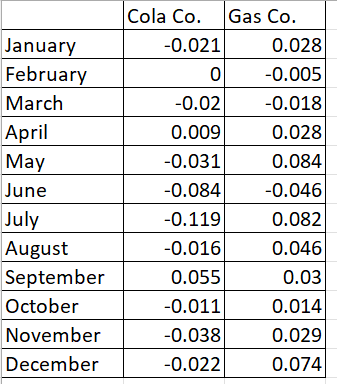
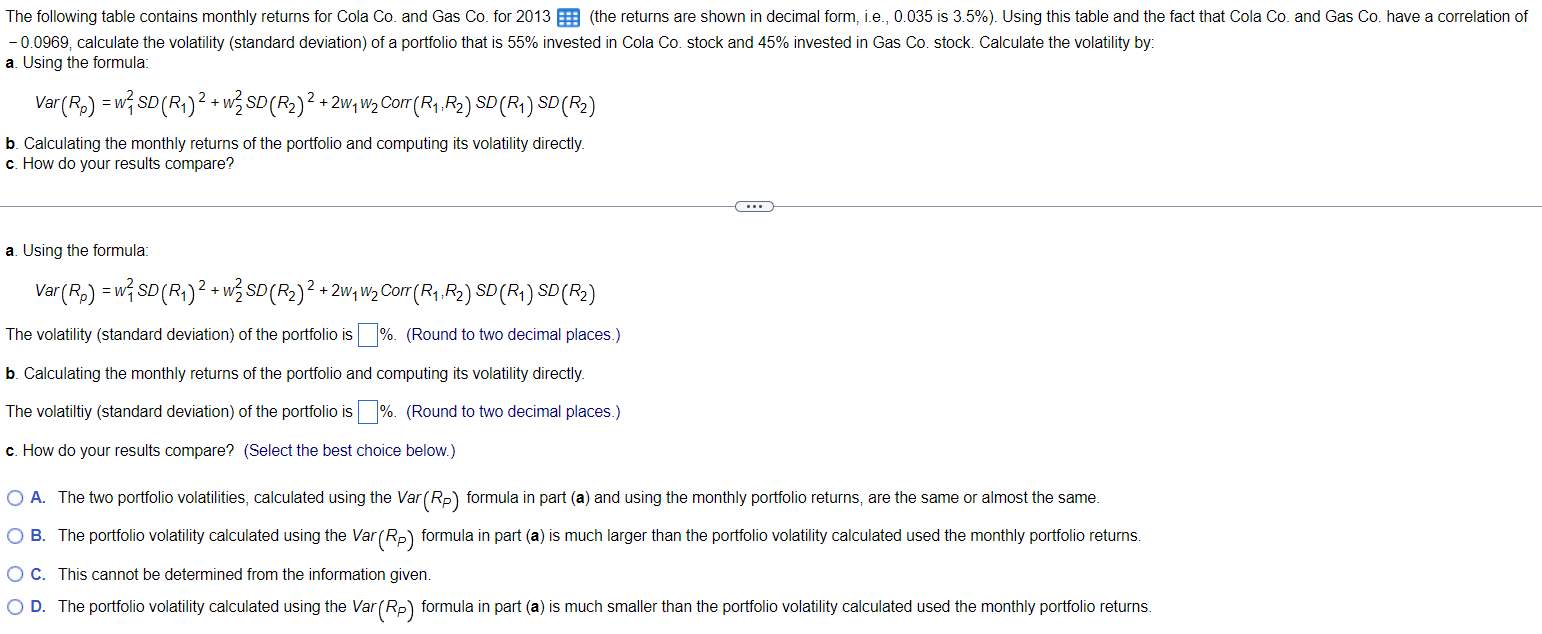
The following table contains monthly returns for Cola Co. and Gas Co. for 2013 (the returns are shown in decimal form, i.e., 0.035 is 3.5% ). Using this table and the fact that Cola Co. and Gas Co. have a correlation of -0.0969 , calculate the volatility (standard deviation) of a portfolio that is 55% invested in Cola Co. stock and 45% invested in Gas Co. stock. Calculate the volatility by: a. Using the formula: Var(Rp)=w12SD(R1)2+w22SD(R2)2+2w1w2Corr(R1,R2)SD(R1)SD(R2) b. Calculating the monthly returns of the portfolio and computing its volatility directly. c. How do your results compare? a. Using the formula: Var(Rp)=w12SD(R1)2+w22SD(R2)2+2w1w2Corr(R1,R2)SD(R1)SD(R2) The volatility (standard deviation) of the portfolio is %. (Round to two decimal places.) b. Calculating the monthly returns of the portfolio and computing its volatility directly. The volatiltiy (standard deviation) of the portfolio is %. (Round to two decimal places.) c. How do your results compare? (Select the best choice below.) A. The two portfolio volatilities, calculated using the Var(RP) formula in part (a) and using the monthly portfolio returns, are the same or almost the same. B. The portfolio volatility calculated using the Var(RP) formula in part (a) is much larger than the portfolio volatility calculated used the monthly portfolio returns. C. This cannot be determined from the information given. D. The portfolio volatility calculated using the Var(RP) formula in part (a) is much smaller than the portfolio volatility calculated used the monthly portfolio returns. \begin{tabular}{|l|r|r|} \hline & Cola Co. & \multicolumn{1}{l|}{ Gas Co. } \\ \hline January & -0.021 & 0.028 \\ \hline February & 0 & -0.005 \\ \hline March & -0.02 & -0.018 \\ \hline April & 0.009 & 0.028 \\ \hline May & -0.031 & 0.084 \\ \hline June & -0.084 & -0.046 \\ \hline July & -0.119 & 0.082 \\ \hline August & -0.016 & 0.046 \\ \hline September & 0.055 & 0.03 \\ \hline October & -0.011 & 0.014 \\ \hline November & -0.038 & 0.029 \\ \hline December & -0.022 & 0.074 \\ \hline \end{tabular}
Step by Step Solution
There are 3 Steps involved in it

Get step-by-step solutions from verified subject matter experts