

Question: Chapter 12 Technology Connection For use after Section 12.1 Spreadsheets and Measures of Central Tendency For this activity, you will need access to a computer
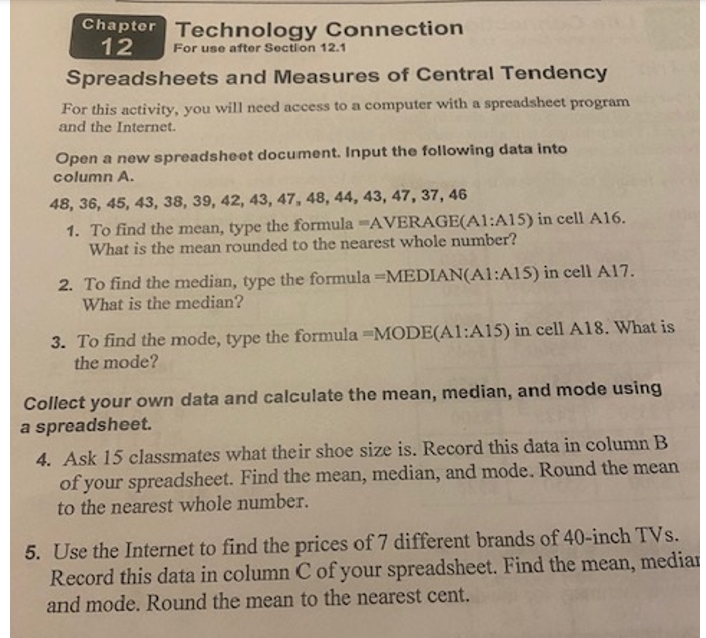
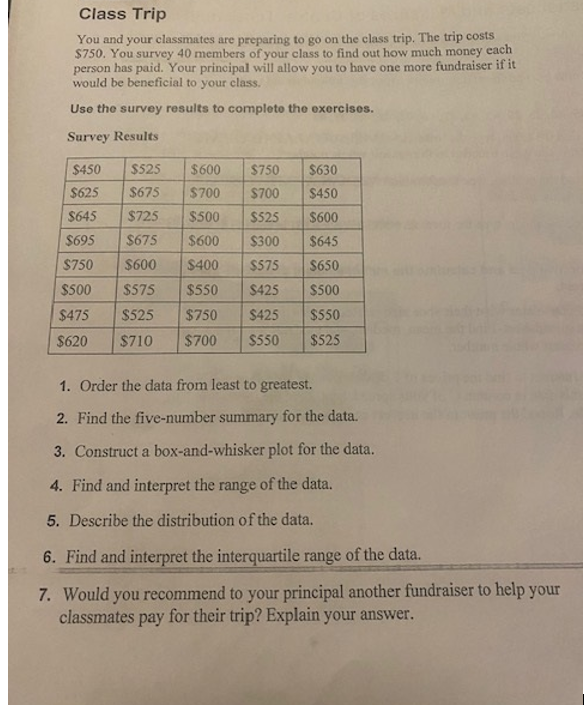
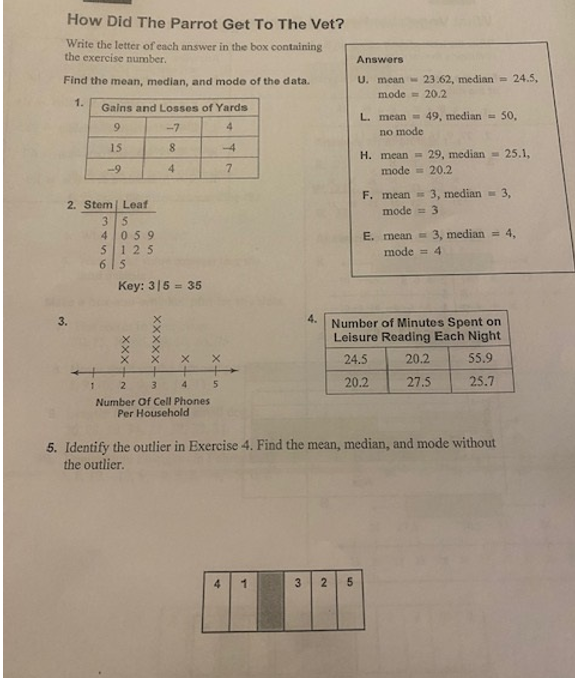
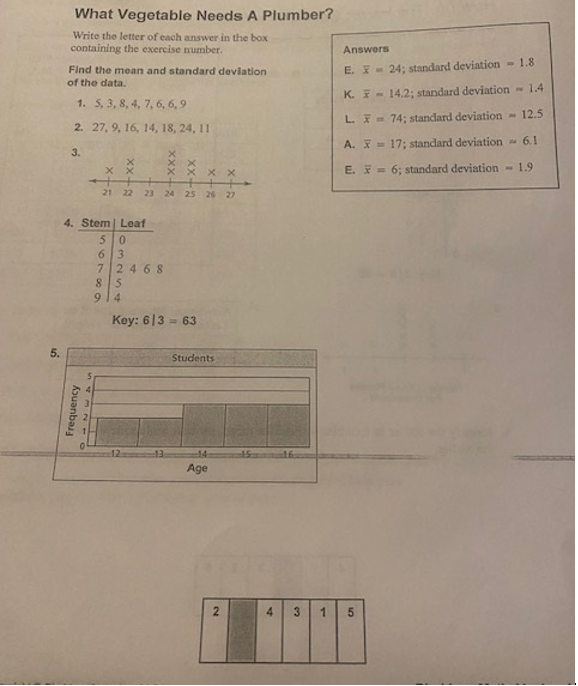
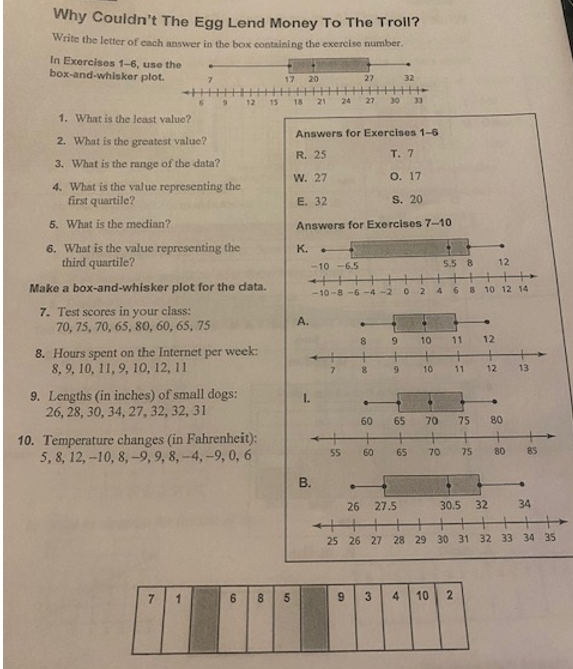
Chapter 12 Technology Connection For use after Section 12.1 Spreadsheets and Measures of Central Tendency For this activity, you will need access to a computer with a spreadsheet program and the Internet. Open a new spreadsheet document. Input the following data into column A. 48, 36, 45, 43, 38, 39, 42, 43, 47, 48, 44, 43, 47, 37, 46 1. To find the mean, type the formula -AVERAGE(A1:A15) in cell A16. What is the mean rounded to the nearest whole number? 2. To find the median, type the formula =MEDIAN(Al:A15) in cell A17. What is the median? 3. To find the mode, type the formula =MODE(A1:A15) in cell A18. What is the mode? Collect your own data and calculate the mean, median, and mode using a spreadsheet. 4. Ask 15 classmates what their shoe size is. Record this data in column B of your spreadsheet. Find the mean, median, and mode. Round the mean to the nearest whole number. 5. Use the Internet to find the prices of 7 different brands of 40-inch TVs. Record this data in column C of your spreadsheet. Find the mean, media and mode. Round the mean to the nearest cent.Class Trip You and your classmates are preparing to go on the class trip. The trip costs $750. You survey 40 members of your class to find out how much money each person has paid. Your principal will allow you to have one more fundraiser if it would be beneficial to your class. Use the survey results to complete the exercises. Survey Results $450 $525 $600 $750 $630 $625 $675 $700 $700 $450 $645 $725 $500 $525 $600 $695 $675 $600 $300 $645 $750 $600 $400 $575 $650 $500 $575 $550 $425 $500 $475 $525 $750 $425 $550 $620 $710 $700 $550 $525 1. Order the data from least to greatest. 2. Find the five-number summary for the data. 3. Construct a box-and-whisker plot for the data. 4. Find and interpret the range of the data. 5. Describe the distribution of the data. 6. Find and interpret the interquartile range of the data. 7. Would you recommend to your principal another fundraiser to help your classmates pay for their trip? Explain your answer.How Did The Parrot Get To The Vet? Write the letter of each answer in the box containing the exercise number. Answers Find the mean, median, and mode of the data. U. mean - 23.62, median = 24.5, mode = 20.2 1. Gains and Losses of Yards L. mean = 49, median = 50, -7 no mode 15 8 -4 H. mean = 29, median = 25.1, 4 7 mode = 20.2 F. mean = 3, median = 3, 2. Stom | Leaf mode = 3 059 E. mean = 3, median = 4, mode = 4 Key: 315 = 35 3. 4. Number of Minutes Spent on Leisure Reading Each Night +Xxxxx +XXX X X 24.5 20.2 55.9 3 20.2 27.5 25.7 Number Of Cell Phones Per Household 5. Identify the outlier in Exercise 4. Find the mean, median, and mode without the outlier. 5What Vegetable Needs A Plumber? Write the letter of each answer in the box containing the exercise number. Answers Find the mean and standard deviation E. F - 24; standard deviation = 1.8 of the data. K. F = 14.2; standard deviation . 1.4 1. 5, 3, 8, 4, 7, 6, 6,9 L. X - 74; standard deviation = 12.5 2. 27, 9, 16, 14, 18, 24, 1 1 A. F = 17; standard deviation ~ 6.1 3. X E. x = 6; standard deviation - 1.9 +xx 21 22 23 4. Stom | Leaf 2468 Koy: 6/3 - 63 5 Students Frequency 13 Age 2 5Why Couldn't The Egg Lend Money To The Troll? Write the letter of each answer in the box containing the exercise number. In Exercises 1-6, use the box-and-whisker plot. 17 20 27 32 24 27 30 7 1. What is the least value? 2. What is the greatest value? Answers for Exercises 1-6 3. What is the range of the data? R. 25 T. 7 4. What is the value representing the W. 27 O. 17 first quartile? E. 32 S. 20 5. What is the median? Answers for Exercises 7-10 6. What is the value representing the K. third quartile? -10 -6.5 5.5 12 Make a box-and-whisker plot for the data. -10-8 -6 -4 -2 8 10 12 14 7. Test scores in your class: 70, 75, 70, 65, 80, 60, 65, 75 A. 10 11 12 8. Hours spent on the Internet per week: 8, 9, 10, 11, 9, 10, 12, 11 11 12 13 9. Lengths (in inches) of small dogs: 26, 28, 30, 34, 27, 32, 32, 31 60 65 70 75 80 10. Temperature changes (in Fahrenheit): 5, 8, 12, -10, 8, -9, 9, 8, -4, -9, 0, 6 55 65 70 75 B. 26 27.5 30.5 32 34 + - 25 26 27 28 29 30 31 32 33 34 35 T 2
Step by Step Solution
There are 3 Steps involved in it

Get step-by-step solutions from verified subject matter experts