

Question: A market analyst wants to know if the new website he designed is showing increased page views per visit. A customer is randomly sent

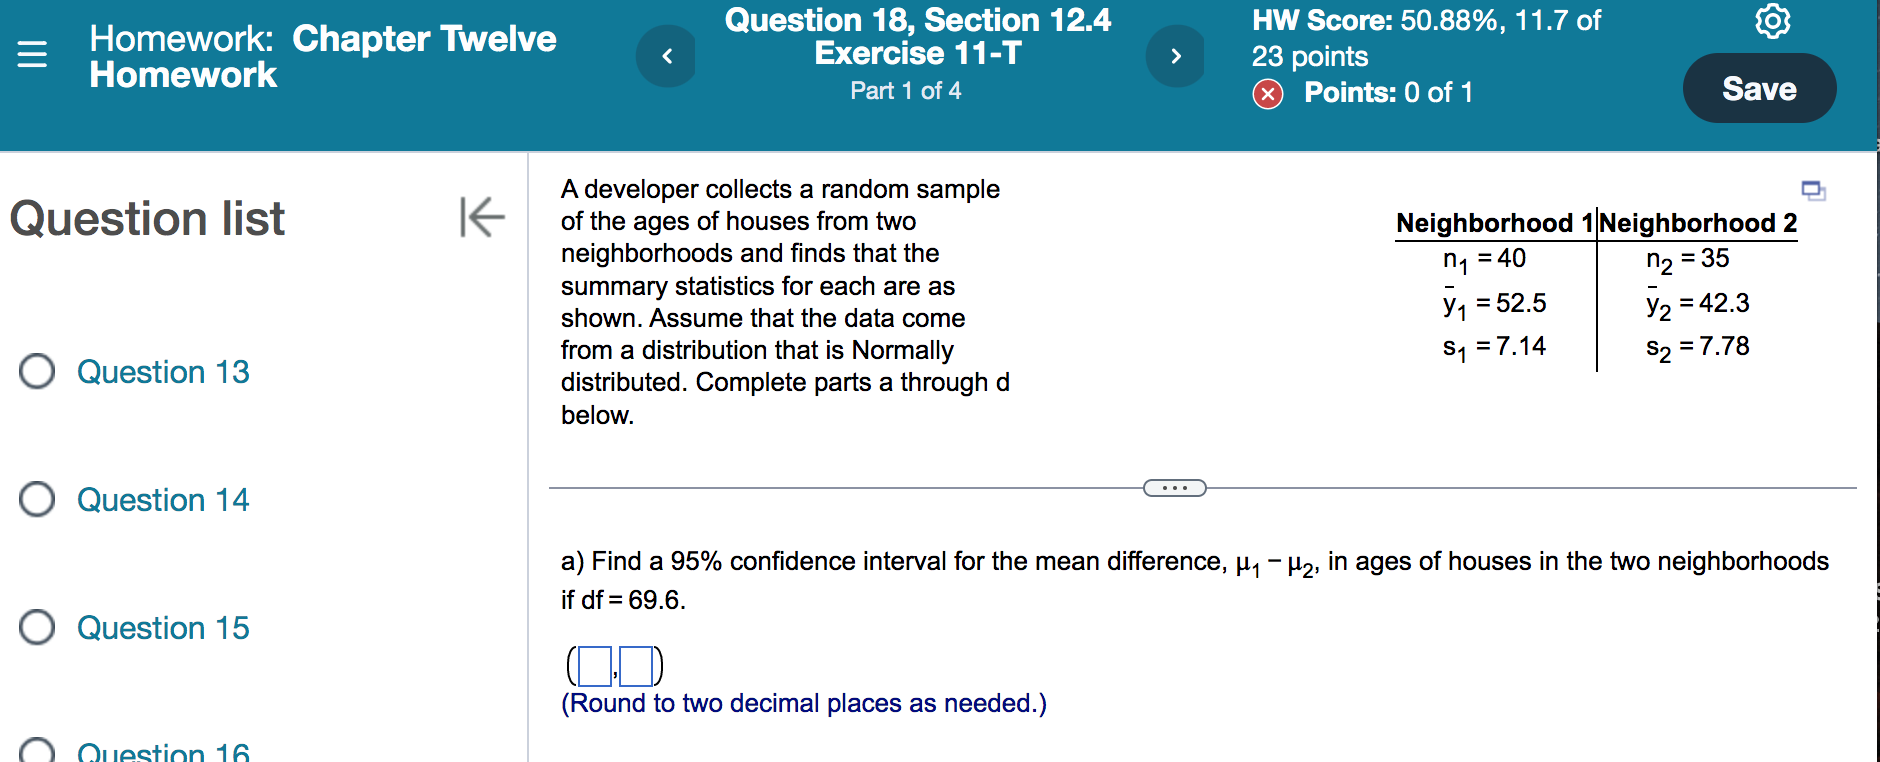
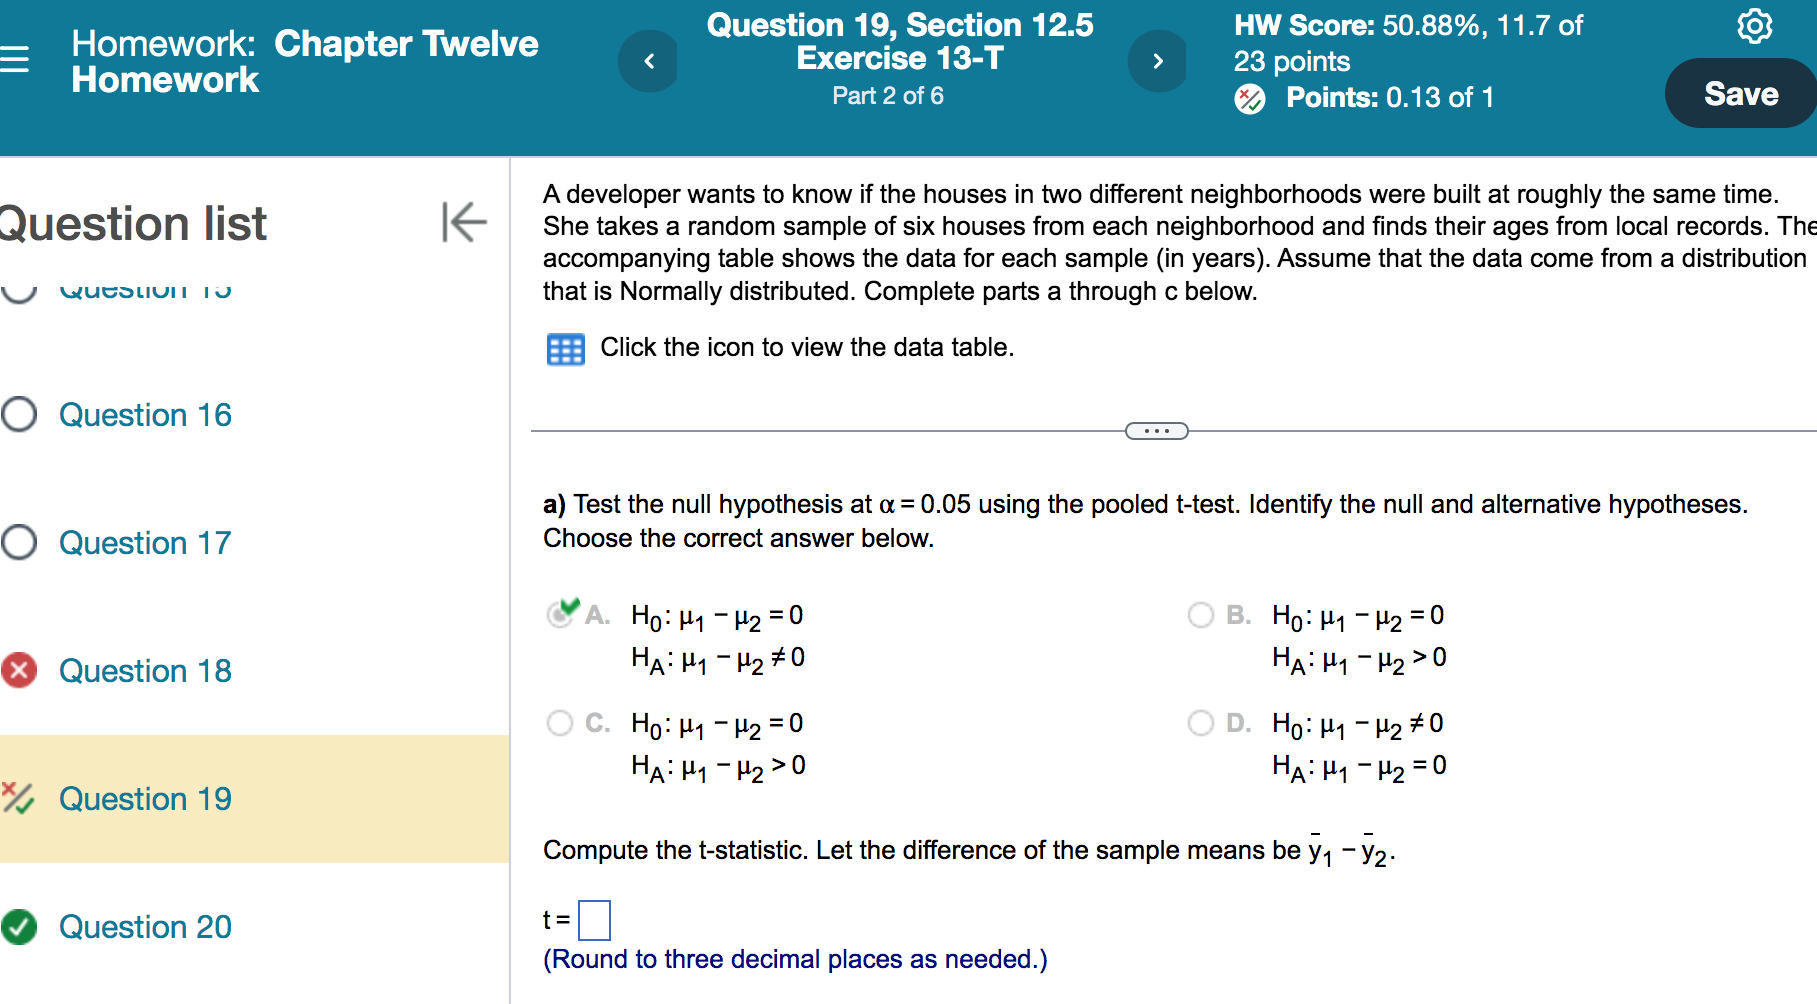
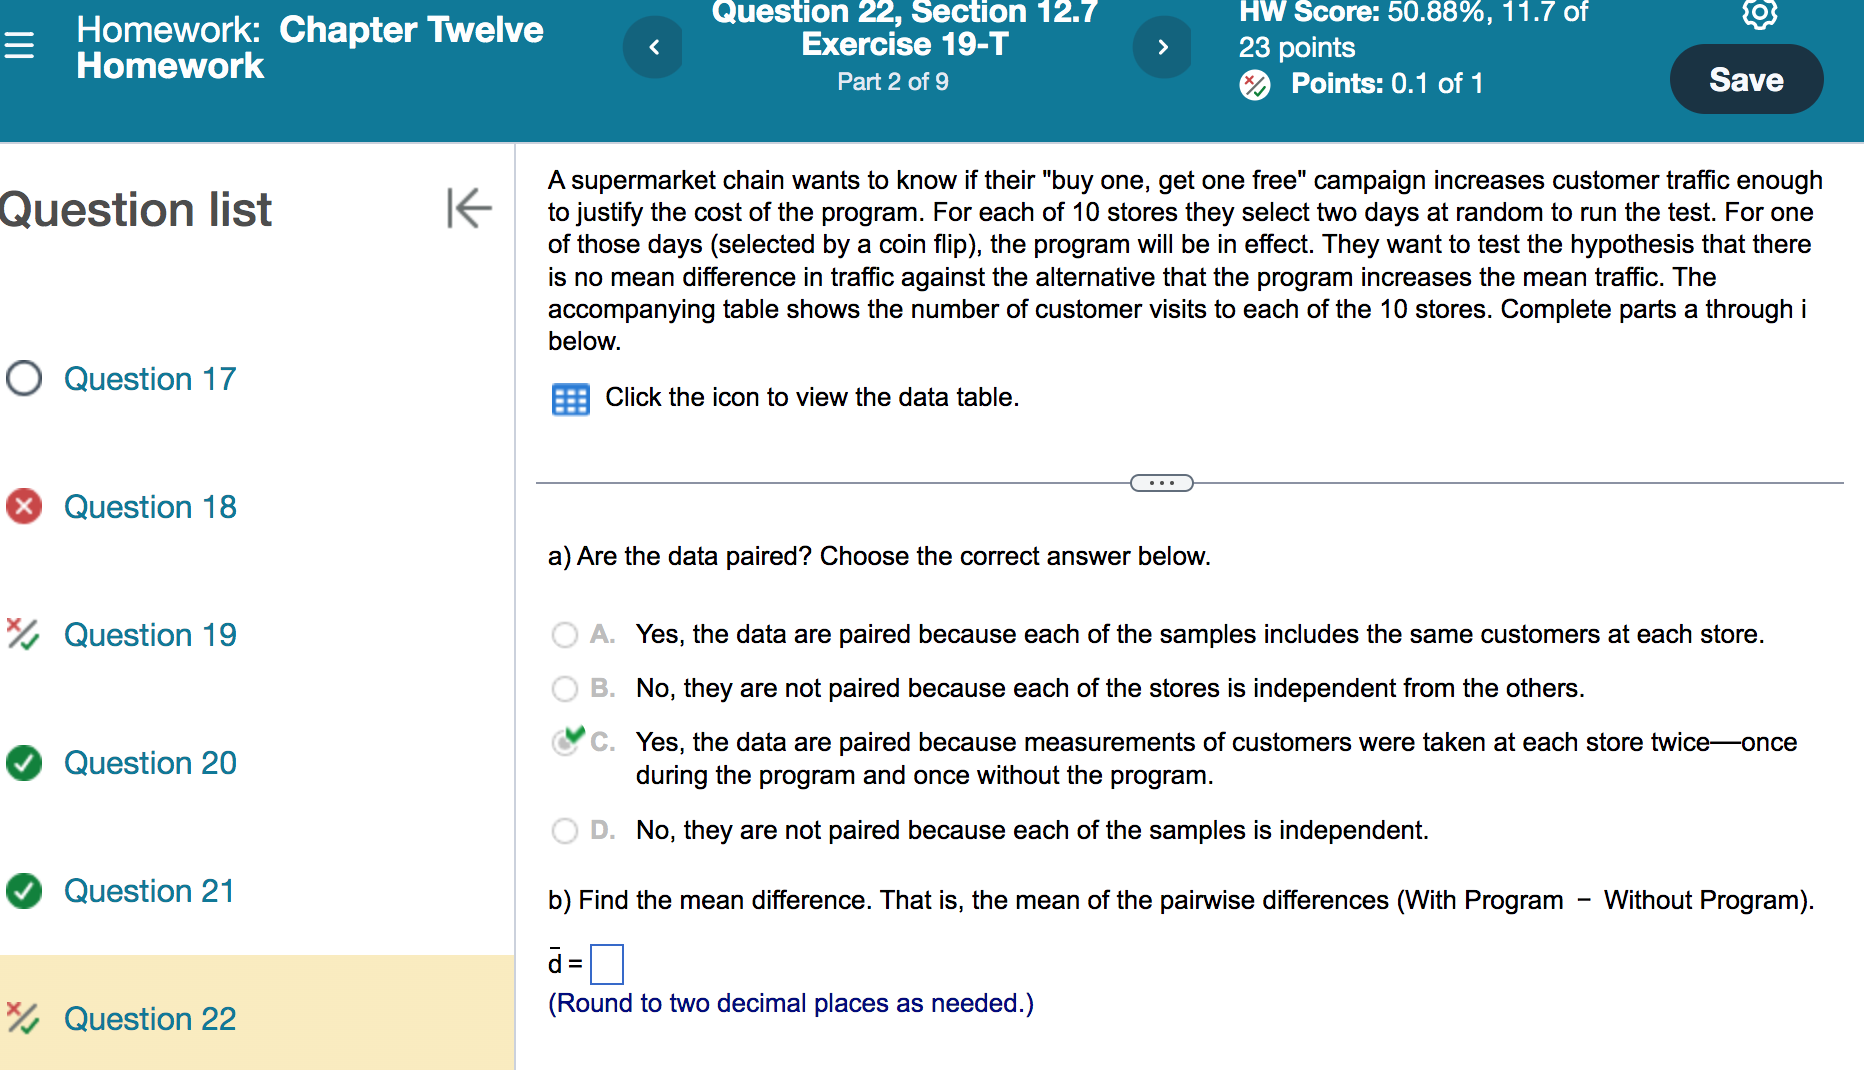
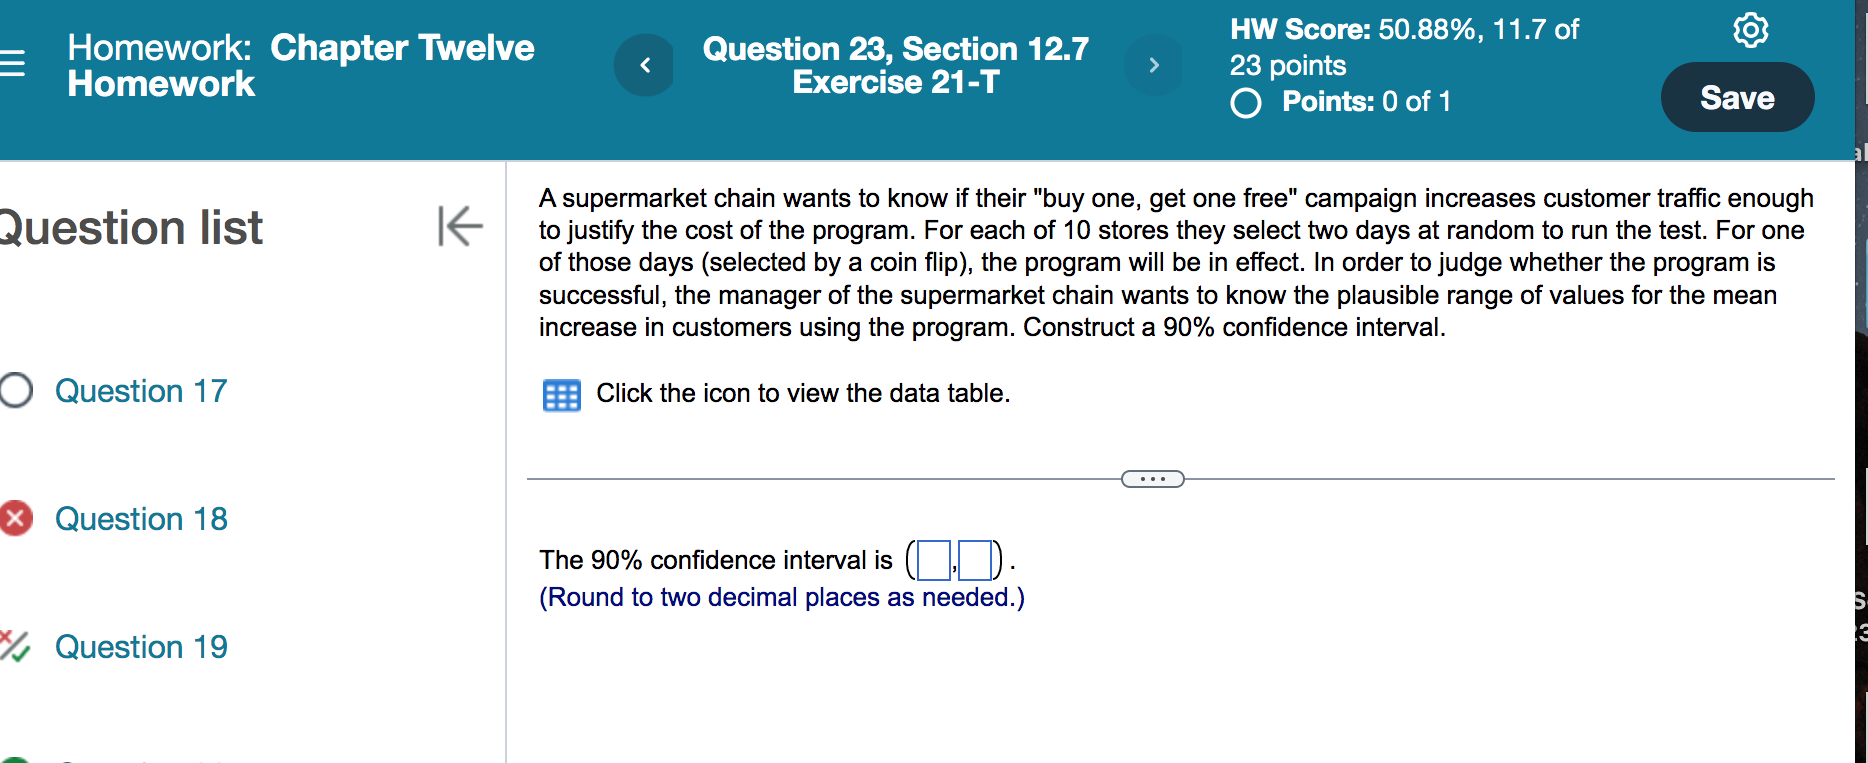
A market analyst wants to know if the new website he designed is showing increased page views per visit. A customer is randomly sent to one of two different websites, offering the same products, but with different designs. The accompanying table shows the data from five randomly chosen customers from each website. Assume that the data come from a distribution that is Normally distributed. Complete parts a through c below. Click the icon to view the data table of website page views per visit. a) Find a 95% confidence interval for the mean difference, - 2, in page views from the two websites. (ID) (Round to two decimal places as needed.) = III Homework: Chapter Twelve Homework Question 18, Section 12.4 Exercise 11-T Part 1 of 4 HW Score: 50.88%, 11.7 of 23 points Points: 0 of 1 Question list Question 13 K A developer collects a random sample of the ages of houses from two neighborhoods and finds that the summary statistics for each are as shown. Assume that the data come from a distribution that is Normally distributed. Complete parts a through d below. Save Neighborhood 1 Neighborhood 2 n = 40 n = 35 y = 52.5 S = 7.14 Y2=42.3 S = 7.78 Question 14 Question 15 a) Find a 95% confidence interval for the mean difference, - , in ages of houses in the two neighborhoods if df = 69.6. Question 16. (Round to two decimal places as needed.) Homework: Chapter Twelve Homework Question 19, Section 12.5 Exercise 13-T Part 2 of 6 Question list QutslivIT TU HW Score: 50.88%, 11.7 of 23 points Points: 0.13 of 1 Save A developer wants to know if the houses in two different neighborhoods were built at roughly the same time. She takes a random sample of six houses from each neighborhood and finds their ages from local records. The accompanying table shows the data for each sample (in years). Assume that the data come from a distribution that is Normally distributed. Complete parts a through c below. Click the icon to view the data table. Question 16 Question 17 Question 18 * Question 19 a) Test the null hypothesis at = 0.05 using the pooled t-test. Identify the null and alternative hypotheses. Choose the correct answer below. A. Ho H1 H2 = 0 H: -20 C. Ho: H1 - H2 =0 HA: H1-H2>0 B. Ho H1 H20 HA: H1-H2>0 D. Ho HH20 = HA H1-H2-0 Compute the t-statistic. Let the difference of the sample means be y -2. Question 20 t= (Round to three decimal places as needed.) Homework: Chapter Twelve Homework Question 22, Section 12.7 Exercise 19-T Part 2 of 9 Question list Question 17 K > HW Score: 50.88%, 11.7 of 23 points Points: 0.1 of 1 Save A supermarket chain wants to know if their "buy one, get one free" campaign increases customer traffic enough to justify the cost of the program. For each of 10 stores they select two days at random to run the test. For one of those days (selected by a coin flip), the program will be in effect. They want to test the hypothesis that there is no mean difference in traffic against the alternative that the program increases the mean traffic. The accompanying table shows the number of customer visits to each of the 10 stores. Complete parts a through i below. Click the icon to view the data table. Question 18 * Question 19 Question 20 a) Are the data paired? Choose the correct answer below. A. Yes, the data are paired because each of the samples includes the same customers at each store. B. No, they are not paired because each of the stores is independent from the others. 'C. Yes, the data are paired because measurements of customers were taken at each store twice-once during the program and once without the program. D. No, they are not paired because each of the samples is independent. Question 21 b) Find the mean difference. That is, the mean of the pairwise differences (With Program Without Program). * Question 22 = (Round to two decimal places as needed.) Homework: Chapter Twelve Homework Question list O Question 17 K Question 23, Section 12.7 Exercise 21-T > HW Score: 50.88%, 11.7 of 23 points Save O Points: 0 of 1 al A supermarket chain wants to know if their "buy one, get one free" campaign increases customer traffic enough to justify the cost of the program. For each of 10 stores they select two days at random to run the test. For one of those days (selected by a coin flip), the program will be in effect. In order to judge whether the program is successful, the manager of the supermarket chain wants to know the plausible range of values for the mean increase in customers using the program. Construct a 90% confidence interval. Click the icon to view the data table. Question 18 Question 19 The 90% confidence interval is (.). (Round to two decimal places as needed.) S 3
Step by Step Solution
There are 3 Steps involved in it
Question 1 95 Confidence Interval for the Mean Difference 1 2 mu1 mu2 12 Given Data Neighborhood 1 n 1 40 n1 40 n140 x 1 525 barx1 525 x1525 s 1 714 s... View full answer

Get step-by-step solutions from verified subject matter experts