

Question: CHAPTER 13 Correlation and Regression 541 Your first step is inspecting the scatterplot of the exam score and Spacing Scale score. Most of the scatterplot
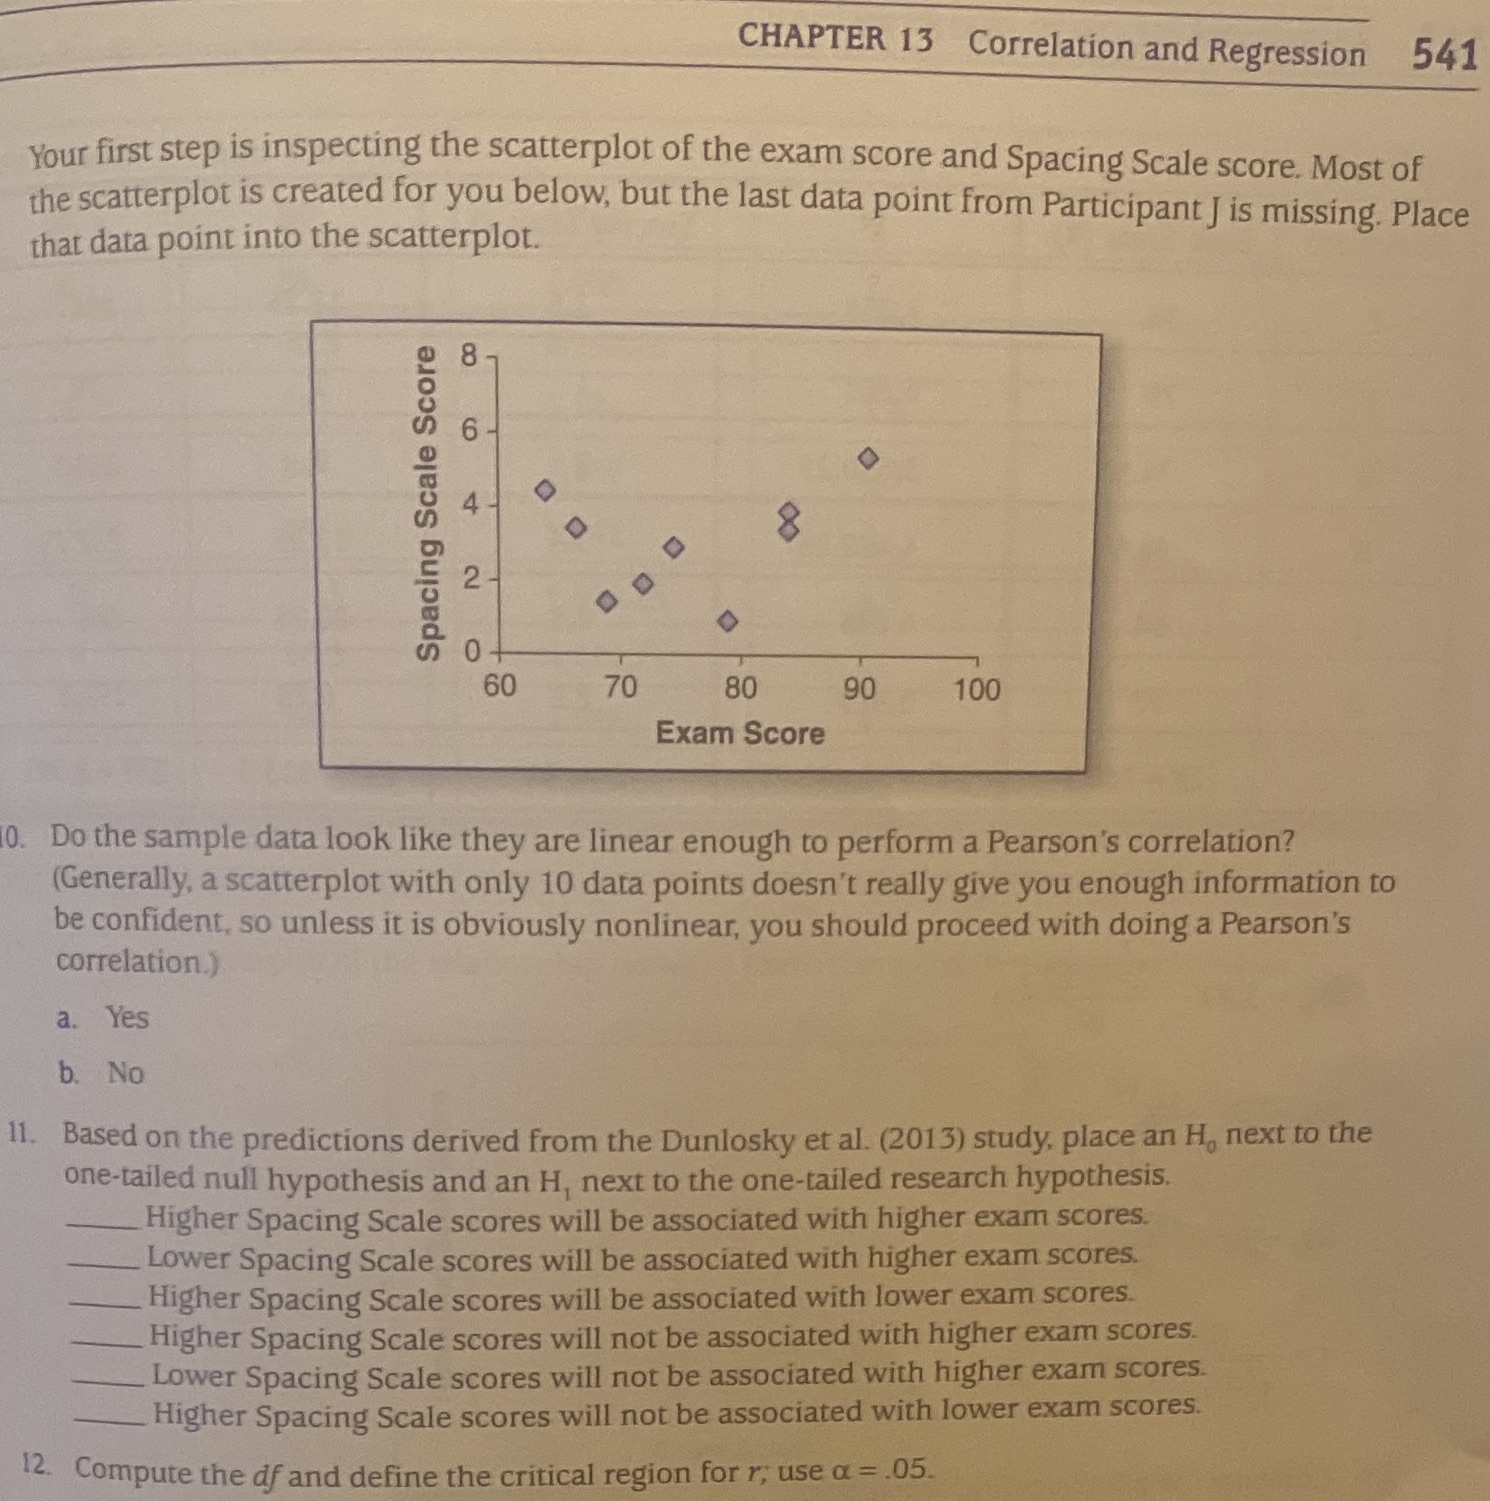
CHAPTER 13 Correlation and Regression 541 Your first step is inspecting the scatterplot of the exam score and Spacing Scale score. Most of the scatterplot is created for you below, but the last data point from Participant J is missing. Place that data point into the scatterplot. co Spacing Scale Score 2 O 60 70 80 90 100 Exam Score 10. Do the sample data look like they are linear enough to perform a Pearson's correlation? (Generally, a scatterplot with only 10 data points doesn't really give you enough information to be confident, so unless it is obviously nonlinear, you should proceed with doing a Pearson's correlation ) a. Yes b. No 11. Based on the predictions derived from the Dunlosky et al. (2013) study, place an H, next to the one-tailed null hypothesis and an H, next to the one-tailed research hypothesis. Higher Spacing Scale scores will be associated with higher exam scores. Lower Spacing Scale scores will be associated with higher exam scores. Higher Spacing Scale scores will be associated with lower exam scores. Higher Spacing Scale scores will not be associated with higher exam scores. Lower Spacing Scale scores will not be associated with higher exam scores. Higher Spacing Scale scores will not be associated with lower exam scores. 12. Compute the df and define the critical region for r, use a = .05
Step by Step Solution
There are 3 Steps involved in it

Get step-by-step solutions from verified subject matter experts