

Question: Chapter 13 Homework: Chapter thirteen Homework Part1 014 0 Points. 0 of 1 A polling institute routinely conducts surveys to gauge the impact of the
Chapter 13
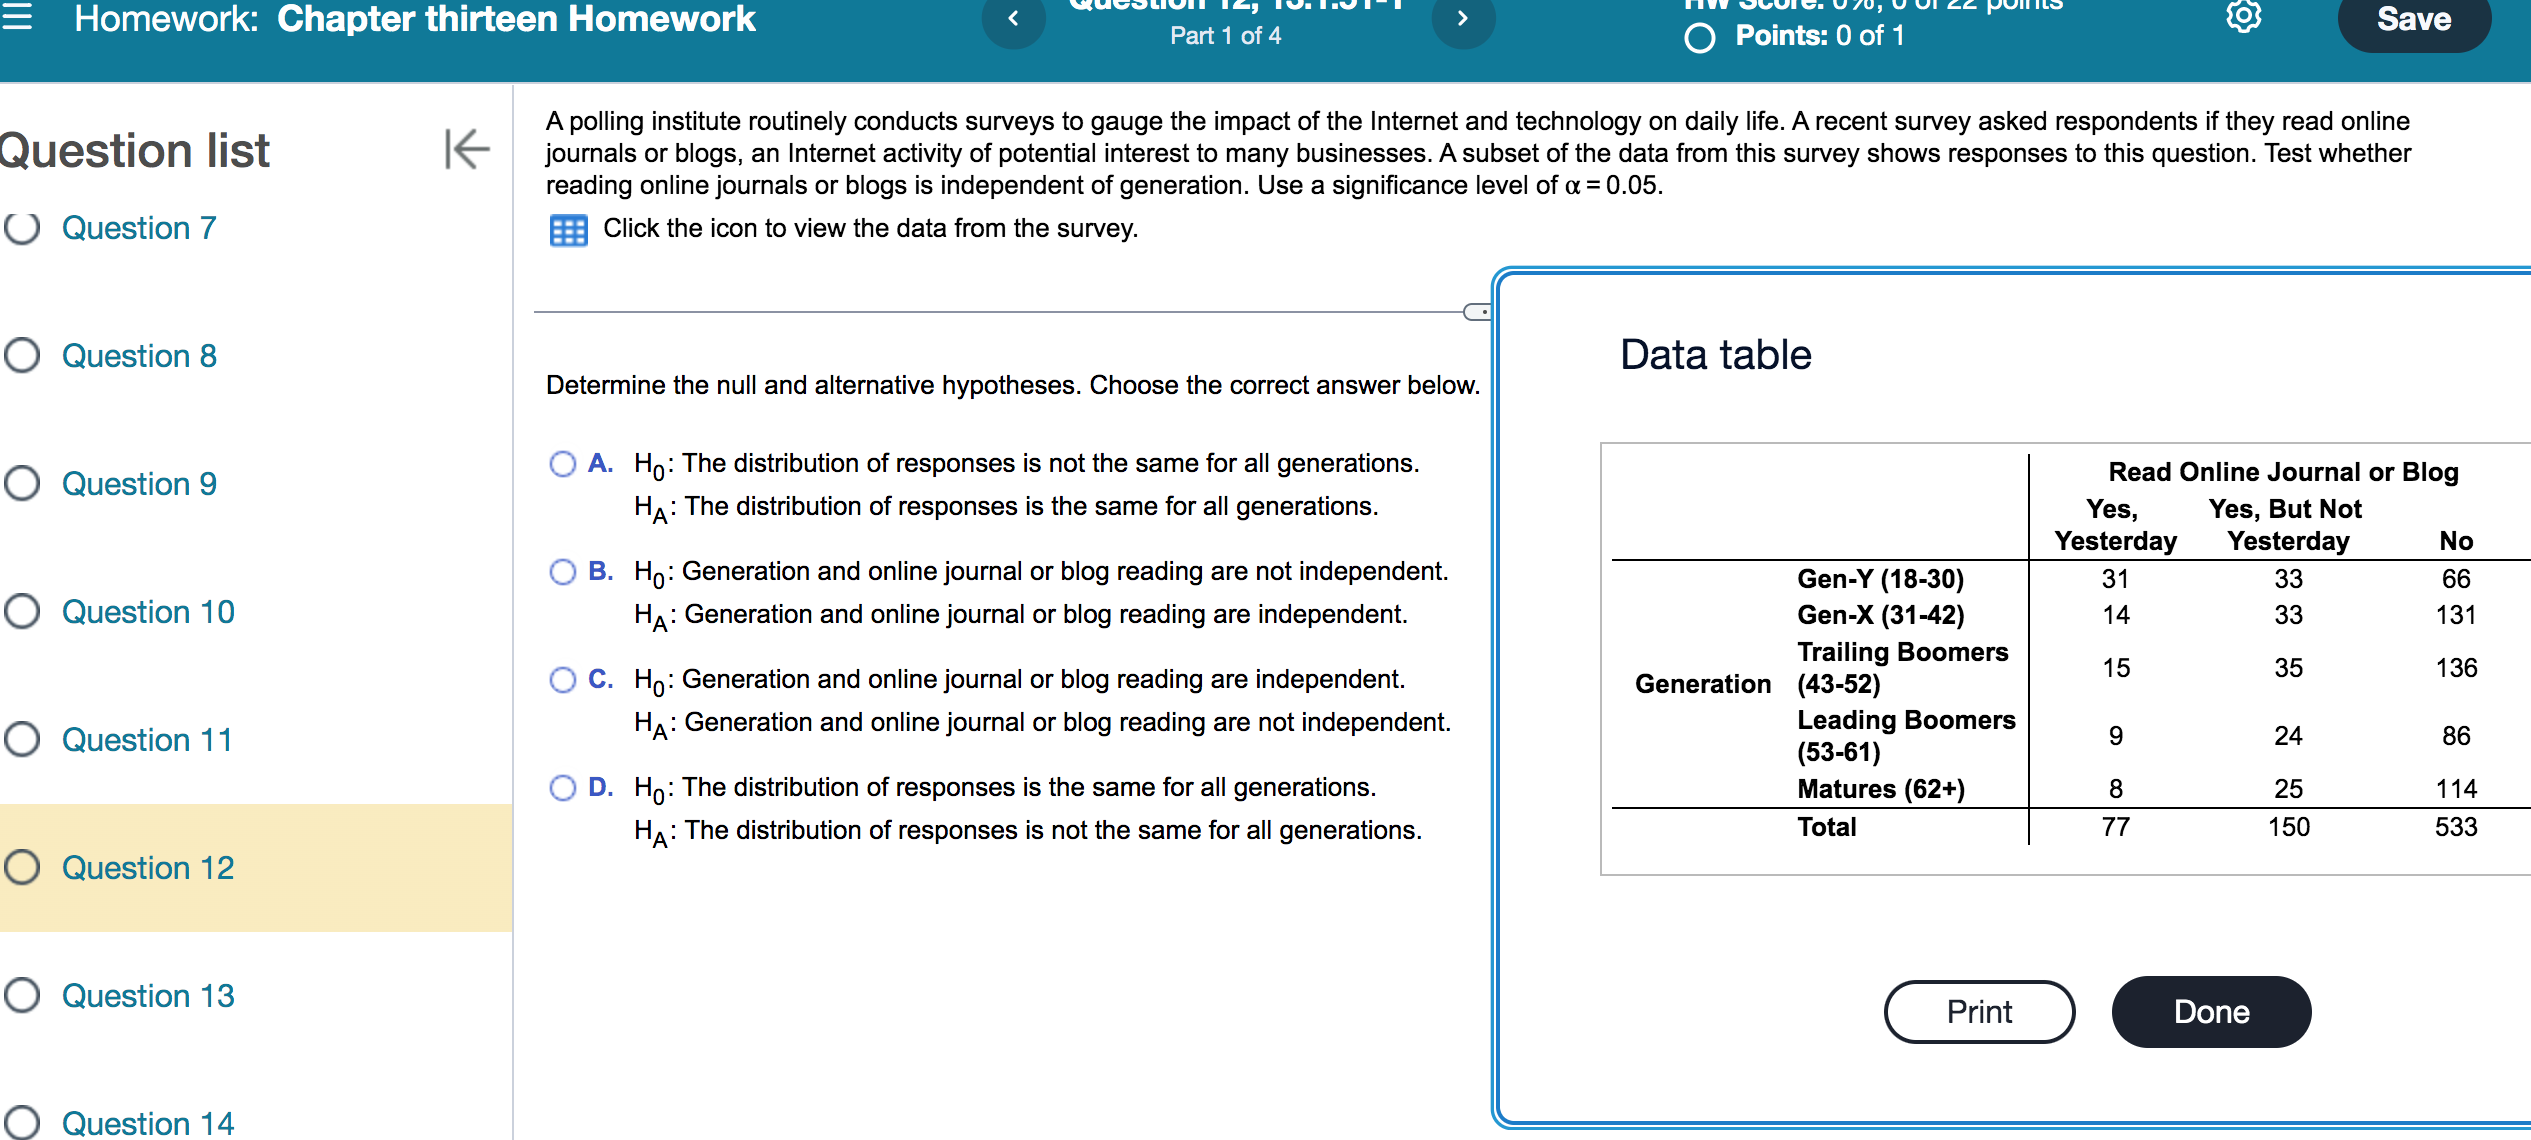
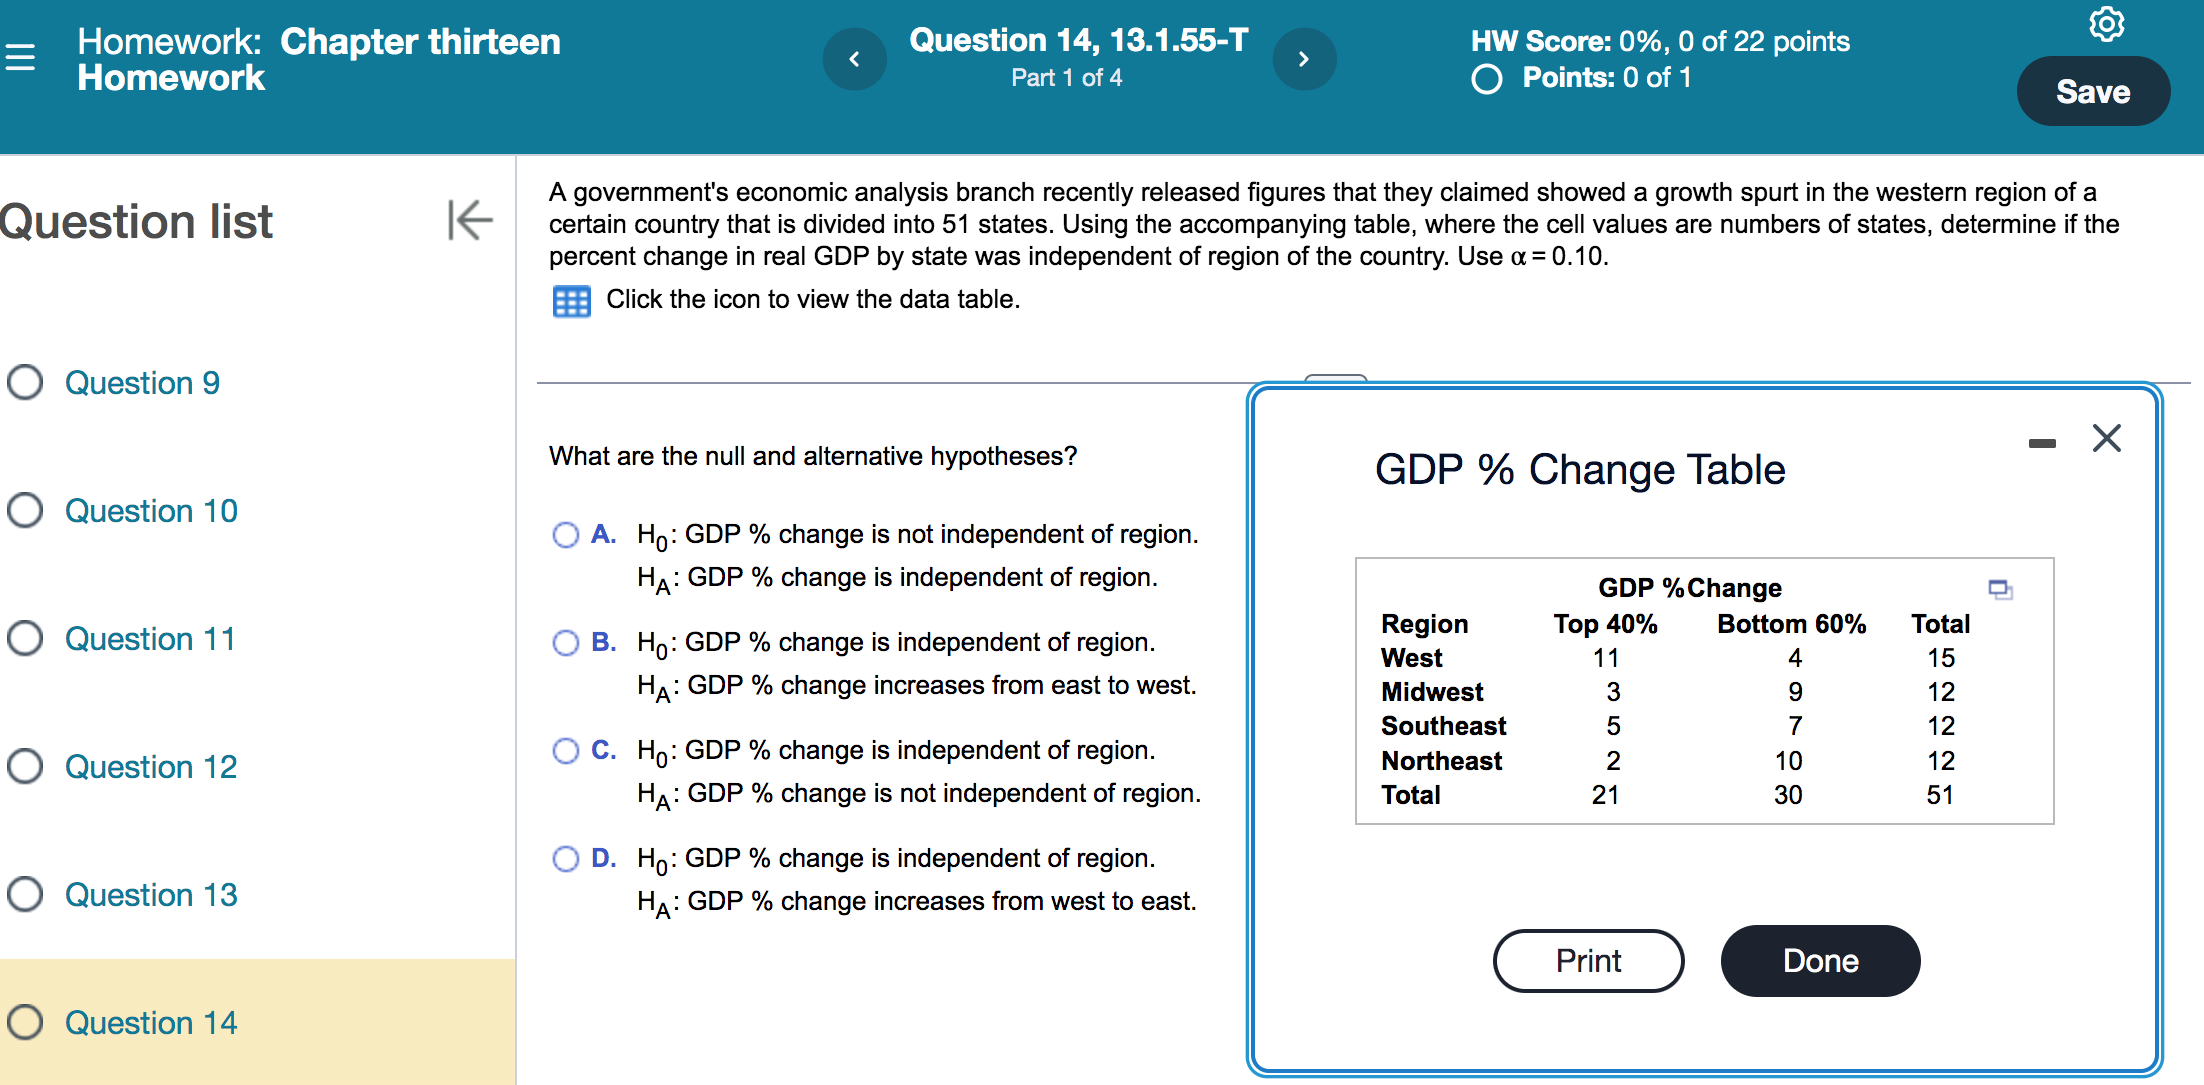
Homework: Chapter thirteen Homework Part1 014 0 Points. 0 of 1 A polling institute routinely conducts surveys to gauge the impact of the Internet and technology on daily life. A recent survey asked respondents if they read online Question list I6 journals or blogs, an Internet activity of potential interest to many businesses. Asubset of the data from this survey shows responses to this question. Test whether reading online journals or blogs is independent of generation. Use a signicance level of or = 0.05. 0 Question 7 g Click the icon to view the data from the survey. { 0 Question 8 Data table Determine the null and alternative hypotheses. Choose the correct answer below. 0 Q est'on 9 (:i A. H0: The distribution of responses is not the same for all generations. Read Online Journal or Blog u I H A: The distribution of responses is the same for all generations. Yes, Yes, But Not Yesterday Yesterday No C) B. Ho: Generation and online journal or biog reading are not independent. Gen-Y (13,30) 31 33 55 0 Question 10 HA: Generation and online journal or blog reading are independent. Gen-X (31-42) 14 33 131 Trailing Boomers 15 35 136 C) 0. H0: Generation and online journal or biog reading are independent. Generation (43.52) 0 Question 1 1 HA: Generation and online journal or blog reading are not independent. ESE-2:29 Boomers 9 24 86 C) D. H0: The distribution of responses is the same for all generations. Matures (62+) 8 25 114 HA: The distribution of responses is not the same for all generations. Total 77 150 533 0 Question 12 0 Question 14 Question 13' 13.1 .53-T HW Score: 0%, 0 of 22 points E Homework: Chapter thirteen Homework O Pointswo In a recent study of enterprise resource planning (ERP) system effectiveness, researchers asked companies how they assessed the success of their ERP systems. Out of Question list [6 370 manufacturing companies surveyed, they found that 130 used return on investment (ROI), 140 used reductions in inventory levels, 36 used improved data quality, and 14 used on-time delivery. In a survey of 280 service rms, 70 used ROI, 60 used inventory levels, 130 used improved data quality, and 20 used on-time delivery. Is 0 Question 7 there evidence that the measures used to assess ERP system effectiveness differ between service and manufacturing rms? Perform the appropriate test and state your conclusion. 0 Question 8 State the null and alternative hypothesis. Choose the correct answer below. 0 Question 9 C) A. H0: There is no pattern in the assessment method by industry sectors. H A: There is a pattern in the assessment method by industry sectors. C) B. H0: The method of assessment is independent of industry sector. 0 QueStlon 10 H A: There is an association between assessment method and industry sector. C) C. Ho: The proportions of assessment method are the same for each industry sector. 0 Question 1 1 H A: The proportion of assessment method is different for at least one industry sector. E Homework: Chapter thirteen Question 14, 13.1.55-T HW Score: 0%, 0 of 22 points Homework Part 1 of 4 O Points: 0 of 1 Save Question list K A government's economic analysis branch recently released figures that they claimed showed a growth spurt in the western region of a certain country that is divided into 51 states. Using the accompanying table, where the cell values are numbers of states, determine if the percent change in real GDP by state was independent of region of the country. Use a = 0.10. Click the icon to view the data table. O Question 9 What are the null and alternative hypotheses? - X GDP % Change Table O Question 10 O A. Ho: GDP % change is not independent of region. HA: GDP % change is independent of region. GDP % Change O Question 11 Region Top 40% Bottom 60% Total O B. Ho: GDP % change is independent of region. West 11 4 15 HA: GDP % change increases from east to west. Midwest 12 Southeast NOT W 12 O Question 12 O C. Ho: GDP % change is independent of region. Northeast 10 12 HA: GDP % change is not independent of region. Total 21 30 51 O D. Ho: GDP % change is independent of region. Question 13 HA: GDP % change increases from west to east. Print Done O Question 14
Step by Step Solution
There are 3 Steps involved in it

Get step-by-step solutions from verified subject matter experts