

Question: Chapter 13 - Section 1. Questions Help Save & Exit Submit Check my work 4 Wenton Powersports produces dune buggies. They have three assembly lines.
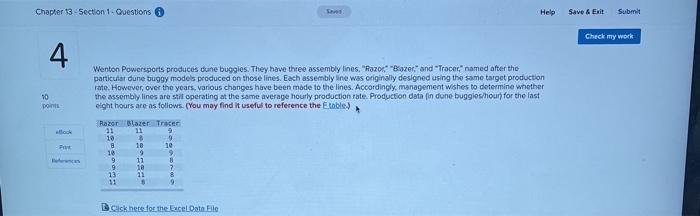
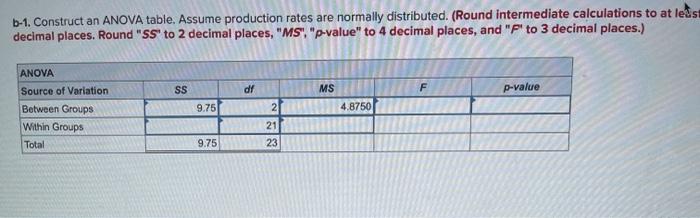
Chapter 13 - Section 1. Questions Help Save & Exit Submit Check my work 4 Wenton Powersports produces dune buggies. They have three assembly lines. "Razor" "Bizer," and "Tracer," named after the particular dune buggy models produced on those lines. Each assembly line was originally designed using the same target production rate. However, over the years, various changes have been made to the lines. Accordingly, management wishes to determine whether the assembly lines are still operating at the same average hourly production rate. Production data in dune buggies/houn for the last eight hours are as follows. (You may find it useful to reference the Etable) 10 points tock Razer Blazer Tracer 21 11 2 10 3 9 B 10 10 10 9 9 9 11 8 .9 10 7 13 11 11 $ 9 Click here for the Excel Data File b-1. Construct an ANOVA table. Assume production rates are normally distributed. (Round intermediate calculations to at lets decimal places. Round "SS" to 2 decimal places, "MS", "p-value" to 4 decimal places, and "P" to 3 decimal places.) SS df MS p-value ANOVA Source of Variation Between Groups Within Groups Total 9.75 4.8750 2 21 23 9.75
Step by Step Solution
There are 3 Steps involved in it

Get step-by-step solutions from verified subject matter experts