

Question: Chapter 14: > 14.3 Excel Activity 1a A sales manager collected data on annual sales for new customer accounts and the number of years of
Chapter 14: > 14.3 Excel Activity 1a
A sales manager collected data on annual sales for new customer accounts and the number of years of experience for a sample of 10 salespersons. In the Microsoft Excel Online file below you will find a sample of data on years of experience of the salesperson and annual sales.
Conduct a regression analysis to explore the relationship between these two variables and then answer the following questions.
- Computeb1andb0(to 1 decimal).
b1= ___________
b0=___________
Complete the estimated regression equation (to 1 decimal).
=________ +________x
b. According to this model, what is the change in annual sales ($1000s) for every year of experience (to 1 decimal)? _________
c. Compute the coefficient of determination (to 3 decimals). Note: reportr2between 0 and 1.
r2=______________
What percentage of the variation in annual sales ($1000s) can be explained by the years of experience of the salesperson (to 1 decimal)? _________%
d. A new salesperson joins the team with 6 years of experience. What is the estimated annual sales ($1000s) for the new salesperson (to the nearest whole number)? $____________
(PLEASE EXCEL ATTACHED)
Here the excel data, you can also see the attached.
Salesperson: 1, 2, 3, 4, 5, 6, 7, 8, 9, 10
Years of Experience: 14, 3, 4, 6,8, 11, 11, 12, 14
Annual Sales ($1000s): 7, 6, 9. 7, 9, 5, 9, 7, 1, 0, 5, 110, 119, 119, 114, 141
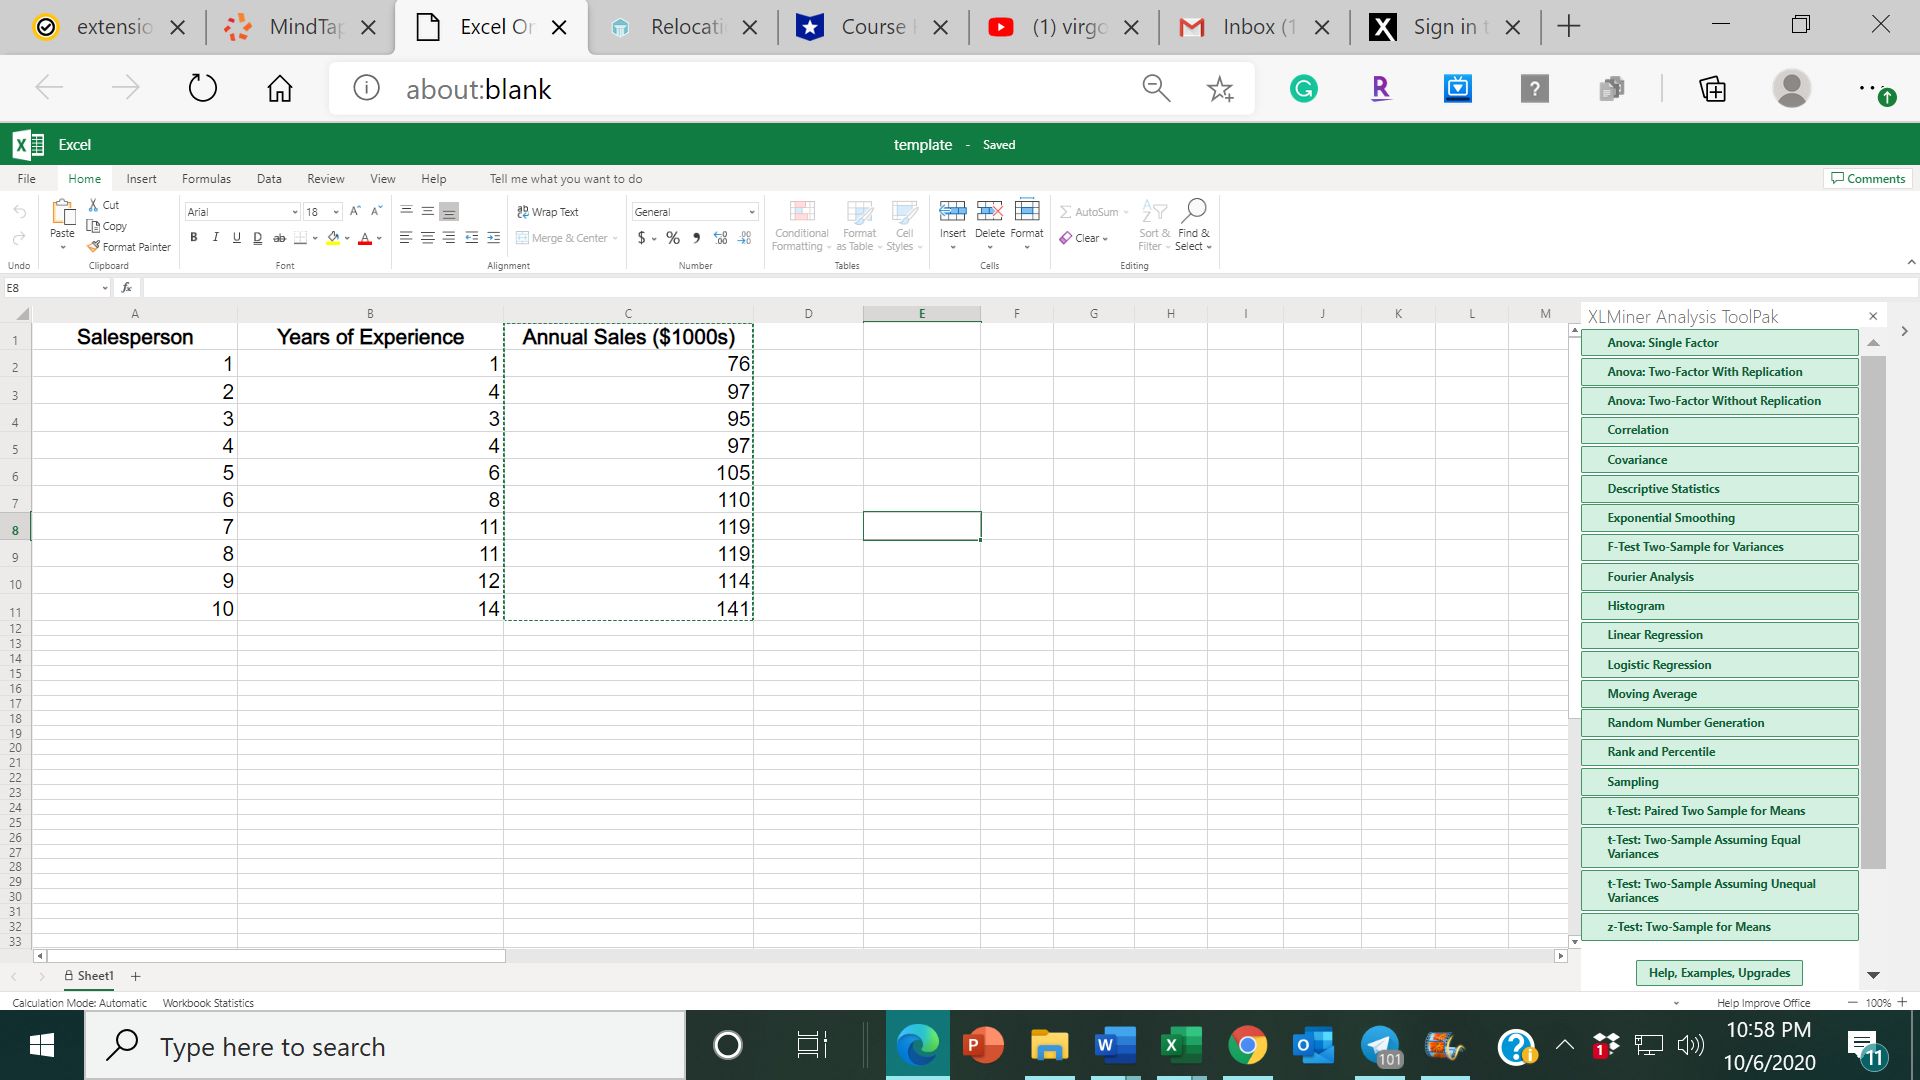
O extension X "MindTar X Excel Or X Relocati Course | X (1) virgo X M Inbox (1 X X Sign in t X X about:blank G R ? T X Excel template - File Home Insert Formulas Data Review View Help Tell me what you want to do Comments 6 & Cut Arial 18 - A A 29 Wrap Text General Autosum . 80 Paste LE Cop B IUD ab . G - A E E Merge & Center - $ ~ % 9 08 48 Conditional Format Cell Insert Delete Format Sort & Find & Format Painter Formatting - as Table . Styles Clear - Filter - Select ~ Undo Clipboard Alignment Number Tables Cells Editing E8 D G M XLMiner Analysis ToolPak Salesperson Years of Experience Annual Sales ($1000s) Anova: Single Factor O 6 0 0 V OR UI A W N - 76 Anova: Two-Factor With Replication 97 Anova: Two-Factor Without Replication 95 Correlation 4 97! Covariance 6: 105 Descriptive Statistics 110 11 119 Exponential Smoothing 11 119 F-Test Two-Sample for Variances 12 114 Fourier Analysis 14 141 Histogram Linear Regression Logistic Regression Moving Average Random Number Generation Rank and Percentile Sampling t-Test: Paired Two Sample for Means t-Test: Two-Sample Assuming Equal Variances t-Test: Two-Sample Assuming Unequal Variances z-Test: Two-Sample for Means A Sheet1 + Help, Examples, Upgrades Calculation Mode: Automatic Workbook Statistics Help Improve Office - 100% + Type here to search O EI w X O 10:58 PM 101 10/6/2020 11
Step by Step Solution
There are 3 Steps involved in it

Get step-by-step solutions from verified subject matter experts