

Question: Chapter 14 & 15 Practice Quiz 1) For a sample of n = 18, the correlation between amount of ice cream sold and temperature was


Chapter 14 & 15 Practice Quiz
1) For a sample of n = 18, the correlation between amount of ice cream sold and temperature was calculated to be0.61.What are the appropriate null and alternative hypotheses to test forcorrelation??
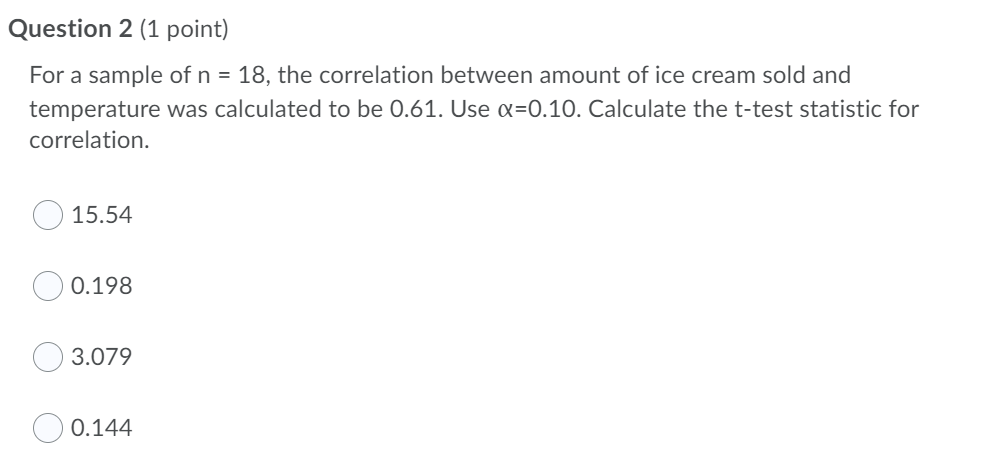
2) For a sample of n = 18, the correlation between amount of ice cream sold and temperature was calculated to be0.61.Use?=0.10. Calculate the?t-test statistic for correlation.
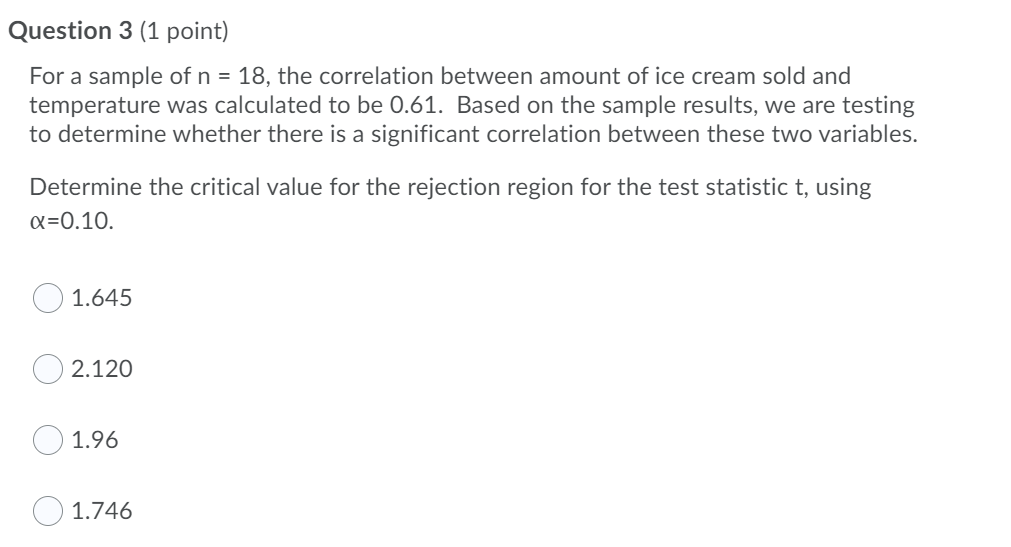
3) For a sample of n = 18, the correlation between amount of ice cream sold and temperature was calculated to be0.61.Based on the sample?results, we are testing to determine whether there is a significantcorrelationbetween these two variables.
Determine the critical?value for the rejection region for the test statistic t, using?=0.10.
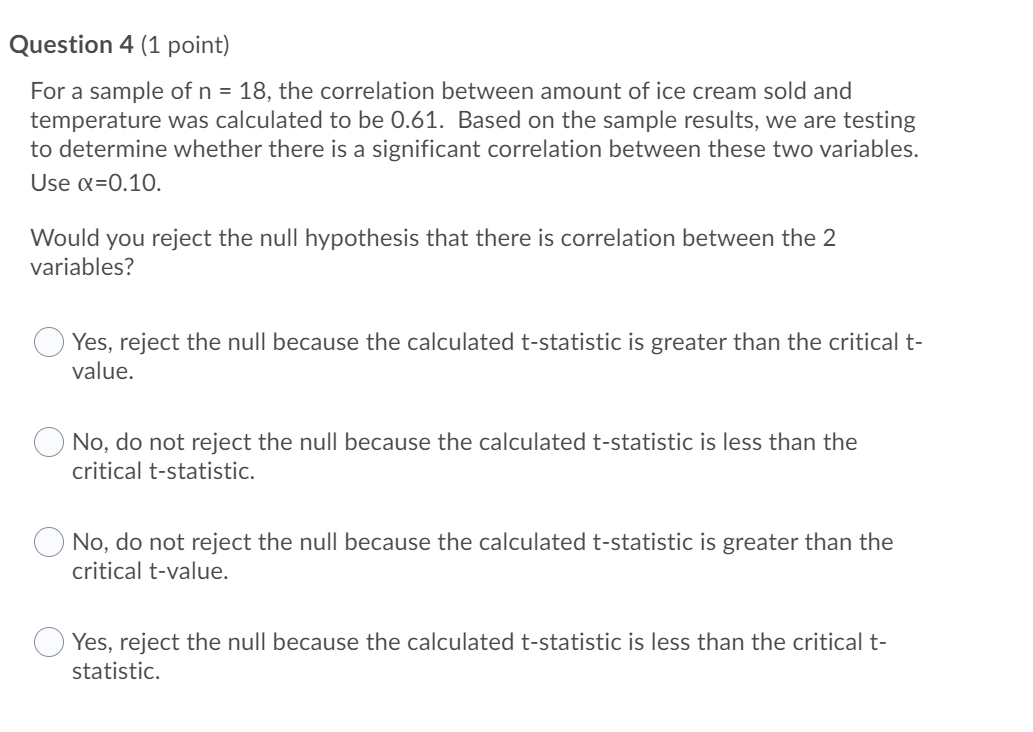
4) For a sample of n = 18, the correlation between amount of ice cream sold and temperature was calculated to be0.61.Based on the sample?results, we are testing to determine whether there is a significantcorrelationbetween these two variables.Use?=0.10.
Would you reject the null hypothesis that there is correlation between the 2 variables?
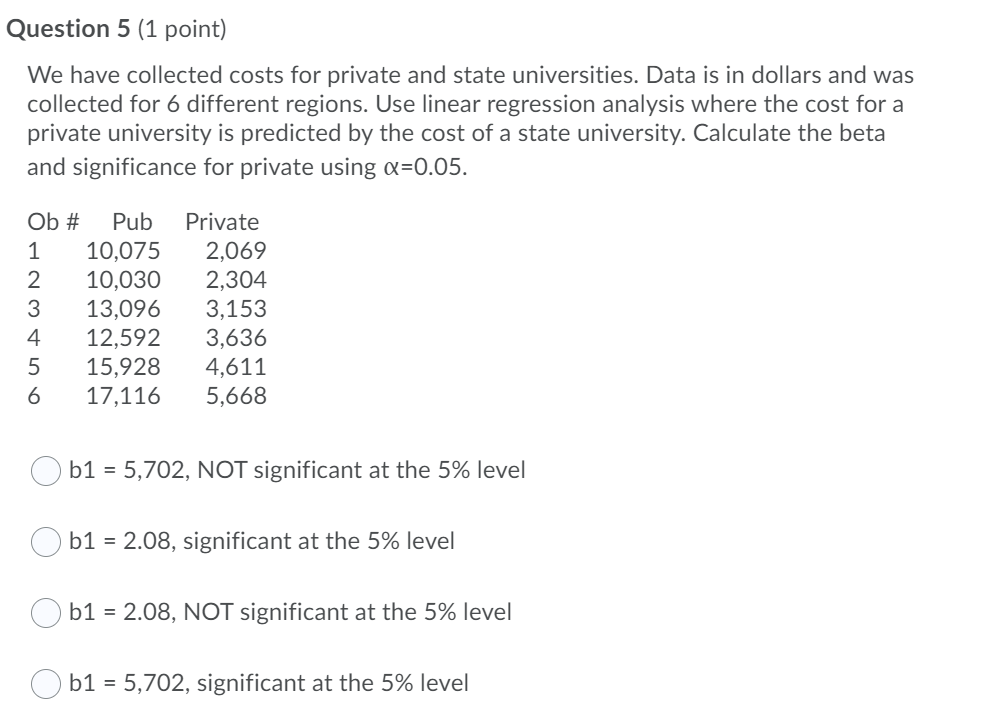
5)We have collected costs for private and state universities. Data is in dollars and was collected for 6 different regions. Use linear regression analysis where the cost for a private university is predicted by the cost of a state university. Calculate the beta and significance for private using?=0.05.
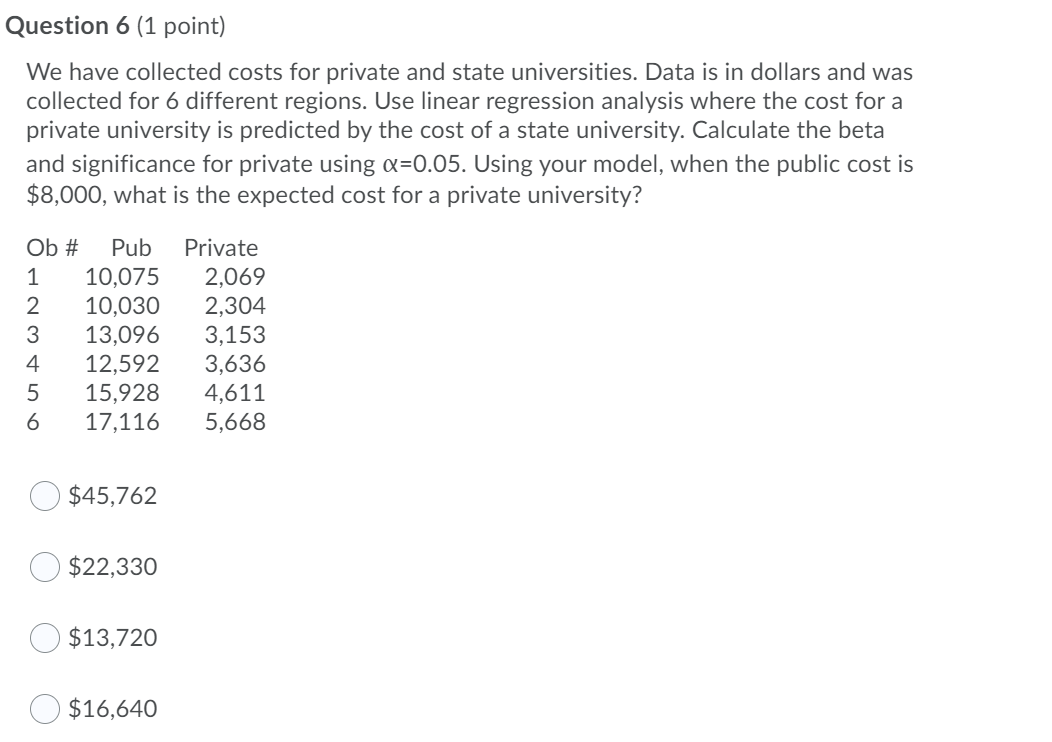
6) We have collected costs for private and state universities. Data is in dollars and was collected for 6 different regions. Use linear regression analysis where the cost for a private university is predicted by the cost of a state university. Calculate the beta and significance for private using?=0.05. Using your model, when the public cost is ?$8,000,what is the expected cost for a private university?
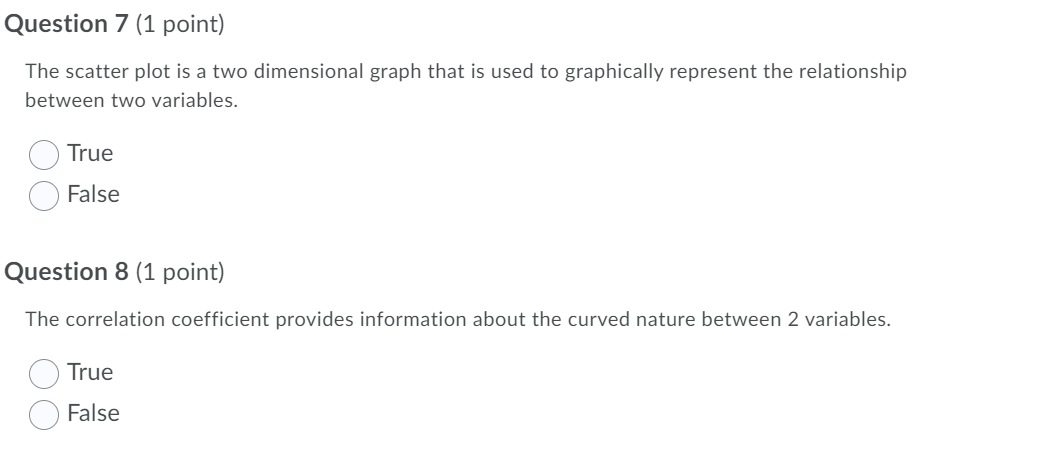
7) The scatter plot is a two dimensional graph that is used to graphically represent the relationship between two variables.
8) The correlation coefficient provides information about the curved nature between 2 variables.
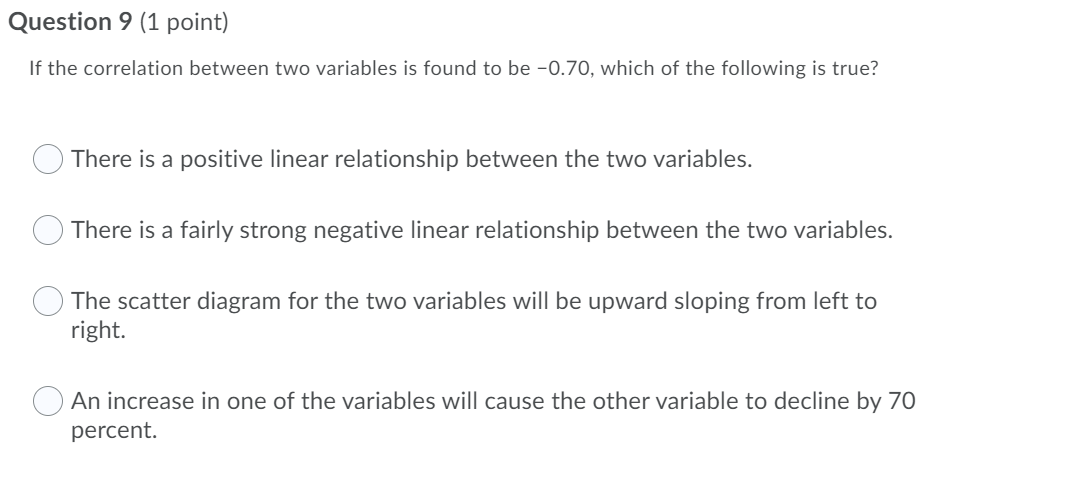
9) If the correlation between two variables is found to be??0.70,which of the following is true?
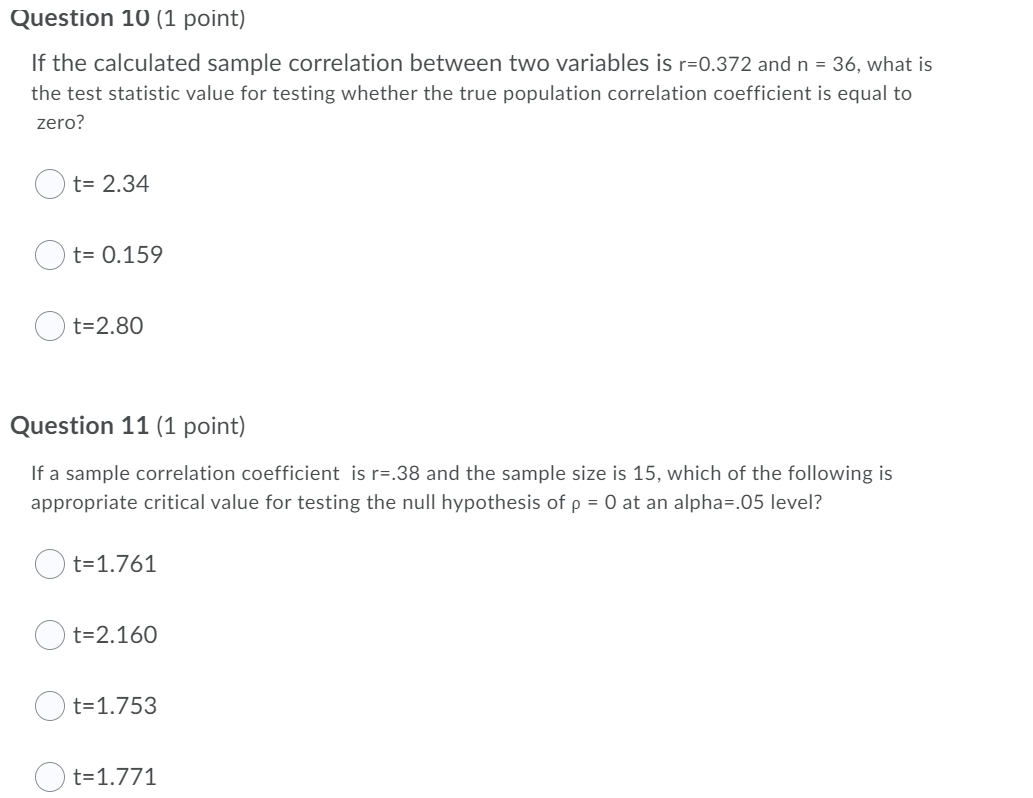
10) If the calculated sample correlation between two variables isr=?0.372 and n = 36,what is the test statistic value for testing whether the true population correlation coefficient is equal to?zero?
11) If a sample correlation coefficientis r=.38 and the sample size is 15,which of the following is appropriate critical value for testing the null hypothesis of?= 0 at analpha=.05?level?

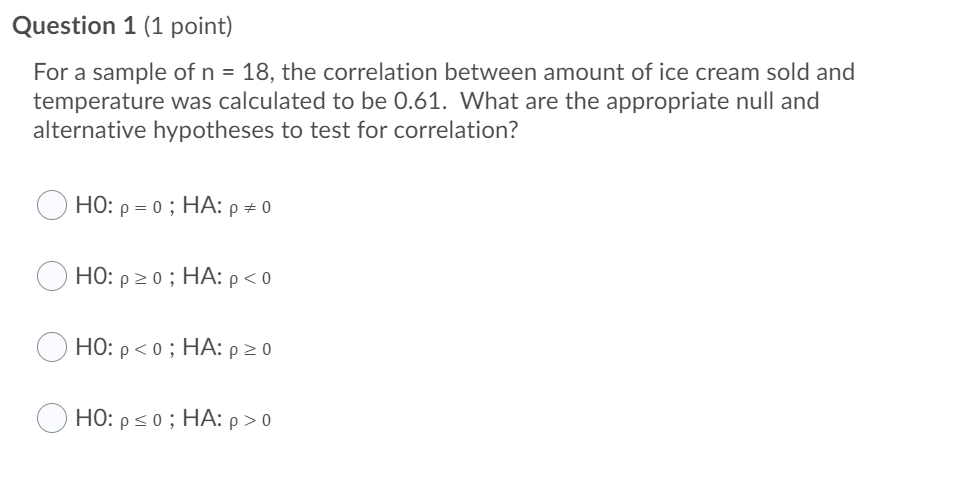


Question 7 (1 point) The scatter plot is a two dimensional graph that is used to graphically represent the relationship between two variables. Question 8 (1 point) The correlation coefficient provides information about the curved nature between 2 variables. Question 1 (1 point) For a sample of n = 18, the correlation between amount of ice cream sold and temperature was calculated to be 0.61. What are the appropriate null and alternative hypotheses to test for correlation? HO: p = 0 ; HA: p # 0 HO: p 2 0 ; HA: P 0Question 10 (1 point) If the calculated sample correlation between two variables is r=O.372 and n = 36, what is the test statistic value for testing whether the true population correlation coefficient is equal to zero? Question 11 (1 point) If a sample correlation coefficient is r=.38 and the sample size is 15, which of the following is appropriate critical value for testing the null hypothesis of p = O at an alpha=.05 level? Question 2 (1 point] For a sample of n = 18, the correlation between amount of ice cream sold and temperature was calculated to be 0.61. Use 0t=0.10. Calculate the ttest statistic for correlation. Question 3 (1 point) For a sample of n = 18, the correlation between amount of ice cream sold and temperature was calculated to be 0.61. Based on the sample results, we are testing to determine whether there is a significant correlation between these two variables. Determine the critical value for the rejection region for the test statistic t, using 0(=0.10. Question 4 (1 point) For a sample of n = 18, the correlation between amount of ice cream sold and temperature was calculated to be 0.61. Based on the sample results, we are testing to determine whether there is a significant correlation between these two variables. Use 01:0.10. Would you reject the null hypothesis that there is correlation between the 2 variables? 0 Yes, reject the null because the calculated t-statistic is greater than the critical t- value. 0 No, do not reject the null because the calculated t-statistic is less than the critical t-statistic. O No, do not reject the null because the calculated t-statistic is greater than the critical t-value. 0 Yes, reject the null because the calculated t-statistic is less than the critical t- statistic. Question 5 (1 point] We have collected costs for private and state universities. Data is in dollars and was collected for 6 different regions. Use linear regression analysis where the cost for a private university is predicted by the cost of a state university. Calculate the beta and significance for private using 0t=0.05. Ob # Pub Private 1 10,075 2,069 2 10,030 2,304 3 13,096 3,153 4 12,592 3,636 5 15,928 4,611 6 17,116 5,668 0 bl = 5,702, NOT significant at the 5% level 0 bl = 2.08, significant at the 5% level 0 bl = 2.08, NOT significant at the 5% level 0 bl = 5,702, significant at the 5% level Question 6 (1 point) We have collected costs for private and state universities. Data is in dollars and was collected for 6 different regions. Use linear regression analysis where the cost for a private university is predicted by the cost of a state university. Calculate the beta and significance for private using 0(=0.05. Using your model, when the public cost is $8,000, what is the expected cost for a private university? Ob# Pub Private 1 10,075 2,069 2 10,030 2,304 3 13,096 3,153 4 12,592 3,636 5 15,928 4,611 6 17,116 5,668 0 $45,762 Q $22,330 0 $13,720 0 $16,640 Question 9 (1 point) If the correlation between two variables is found to be -O.70, which of the following is true? 0 There is a positive linear relationship between the two variables. 0 There is a fairly strong negative linear relationship between the two variables. 0 The scatter diagram for the two variables will be upward sloping from left to right. 0 An increase in one of the variables will cause the other variable to decline by 70 percent
Step by Step Solution
There are 3 Steps involved in it

Get step-by-step solutions from verified subject matter experts