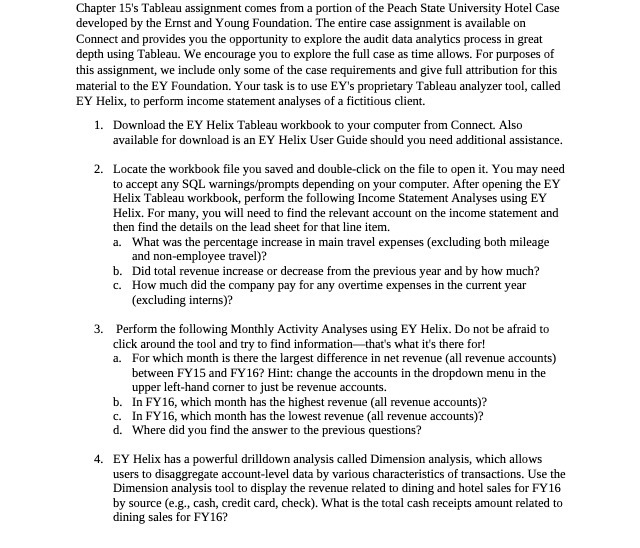
Question: Chapter 15's Tableau assignment comes from a portion of the Peach State University Hotel Case developed by the Ernst and Young Foundation. The entire case

Chapter 15's Tableau assignment comes from a
Chapter 15's Tableau assignment comes from a portion of the Peach State University Hotel Case developed by the Ernst and Young Foundation. The entire case assignment is available on Connect and provides you the opportunity to explore the audit data analytics process in great depth using Tableau. We encourage you to explore the full case as time allows. For purposes of this assignment, we include only some of the case requirements and give full attribution for this material to the EY Foundation. Your task is to use EY's proprietary Tableau analyzer tool, called EY Helix, to perform income statement analyses of a fictitious client. 1. Download the EY Helix Tableau workbook to your computer from Connect. Also available for download is an EY Helix User Guide should you need additional assistance. 2. Locate the workbook file you saved and double-click on the file to open it. You may need to accept any SQL warnings/prompts depending on your computer. After opening the EY Helix Tableau workbook, perform the following Income Statement Analyses using EY Helix. For many, you will need to find the relevant account on the income statement and then find the details on the lead sheet for that line item. a. What was the percentage increase in main travel expenses (excluding both mileage and non-employee travel)? b. Did total revenue increase or decrease from the previous year and by how much? c. How much did the company pay for any overtime expenses in the current year (excluding interns)? 3. Perform the following Monthly Activity Analyses using EY Helix. Do not be afraid to click around the tool and try to find information-that's what it's there for! a. For which month is there the largest difference in net revenue (all revenue accounts) between FY15 and FY 16? Hint: change the accounts in the dropdown menu in the upper left-hand corner to just be revenue accounts. b. In FY16, which month has the highest revenue (all revenue accounts)? c. In FY16, which month has the lowest revenue (all revenue accounts)? d. Where did you find the answer to the previous questions? 4. EY Helix has a powerful drilldown analysis called Dimension analysis, which allows users to disaggregate account-level data by various characteristics of transactions. Use the Dimension analysis tool to display the revenue related to dining and hotel sales for FY 16 by source (e.g., cash, credit card, check). What is the total cash receipts amount related to dining sales for FY16

Step by Step Solution

There are 3 Steps involved in it

1 Expert Approved Answer
Step: 1 Unlock blur-text-image
Question Has Been Solved by an Expert!

Get step-by-step solutions from verified subject matter experts

Step: 2 Unlock
Step: 3 Unlock

Students Have Also Explored These Related Accounting Questions!