

Question: Chapter 18 Operating data for Poll Corporation are presented below. 2017 2016 Net sales $900,000 $700,000 Cost of goods sold 570,000 450,000 Selling expenses 140,000
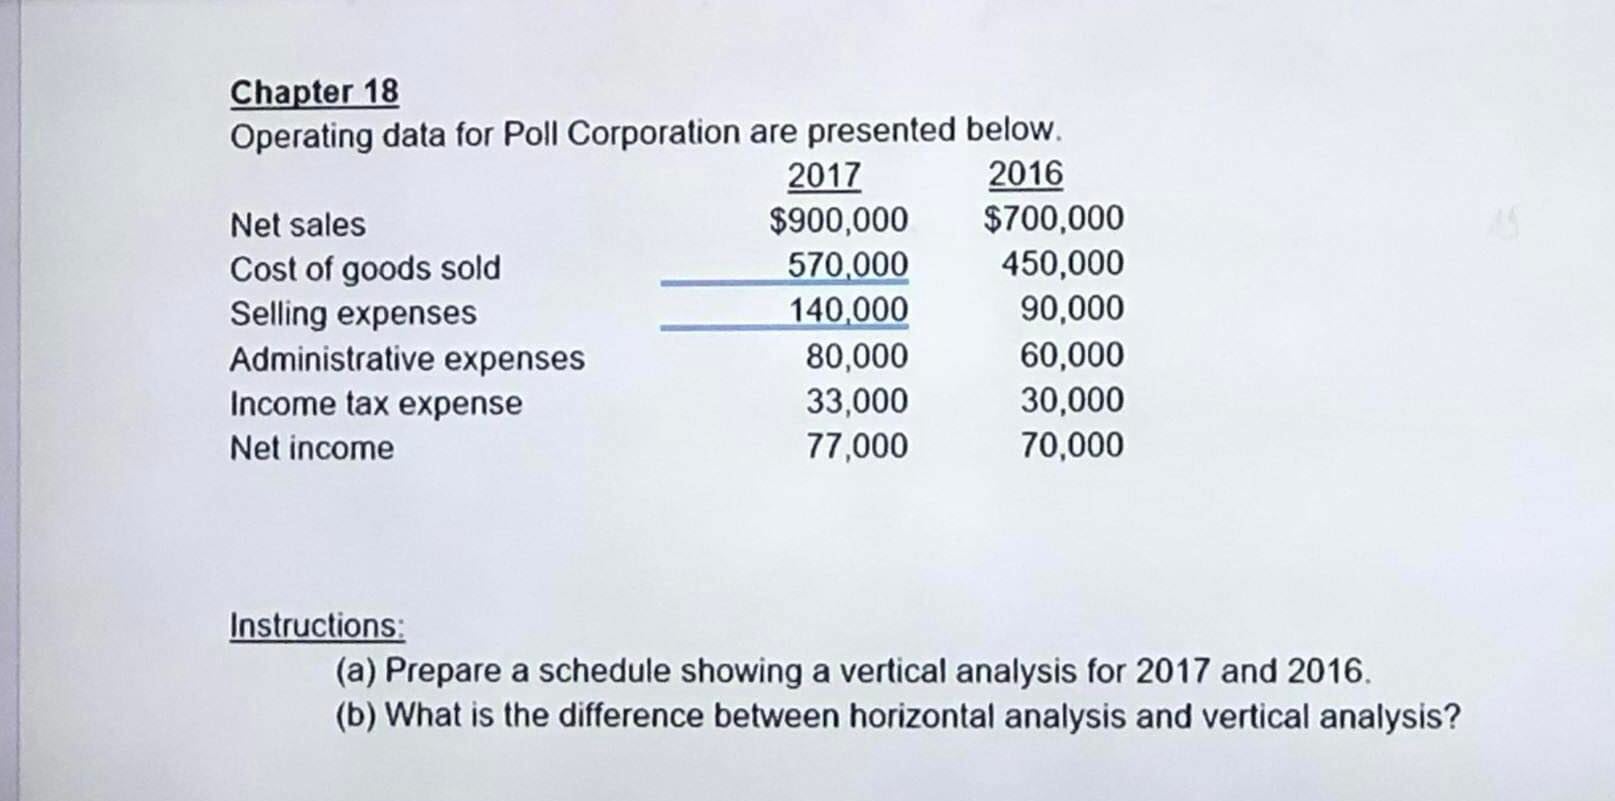
Chapter 18 Operating data for Poll Corporation are presented below. 2017 2016 Net sales $900,000 $700,000 Cost of goods sold 570,000 450,000 Selling expenses 140,000 90,000 Administrative expenses 80,000 60,000 Income tax expense 33,000 30,000 Net income 77,000 70,000 Instructions: (a) Prepare a schedule showing a vertical analysis for 2017 and 2016. (b) What is the difference between horizontal analysis and vertical analysis
Step by Step Solution
There are 3 Steps involved in it
1 Expert Approved Answer
Step: 1 Unlock

Question Has Been Solved by an Expert!
Get step-by-step solutions from verified subject matter experts
Step: 2 Unlock
Step: 3 Unlock