Question: Chapter 2 Problem 15 a. For the years 2005-2009, calculate the following for Boeing: i. Total liabilities-to-equity ratio ii. Times-interest-earned ratio iii. Times-burden-covered ratio b.
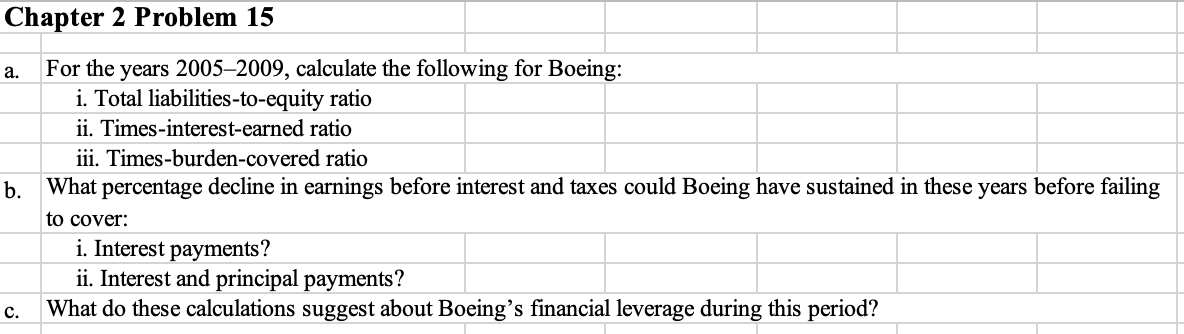
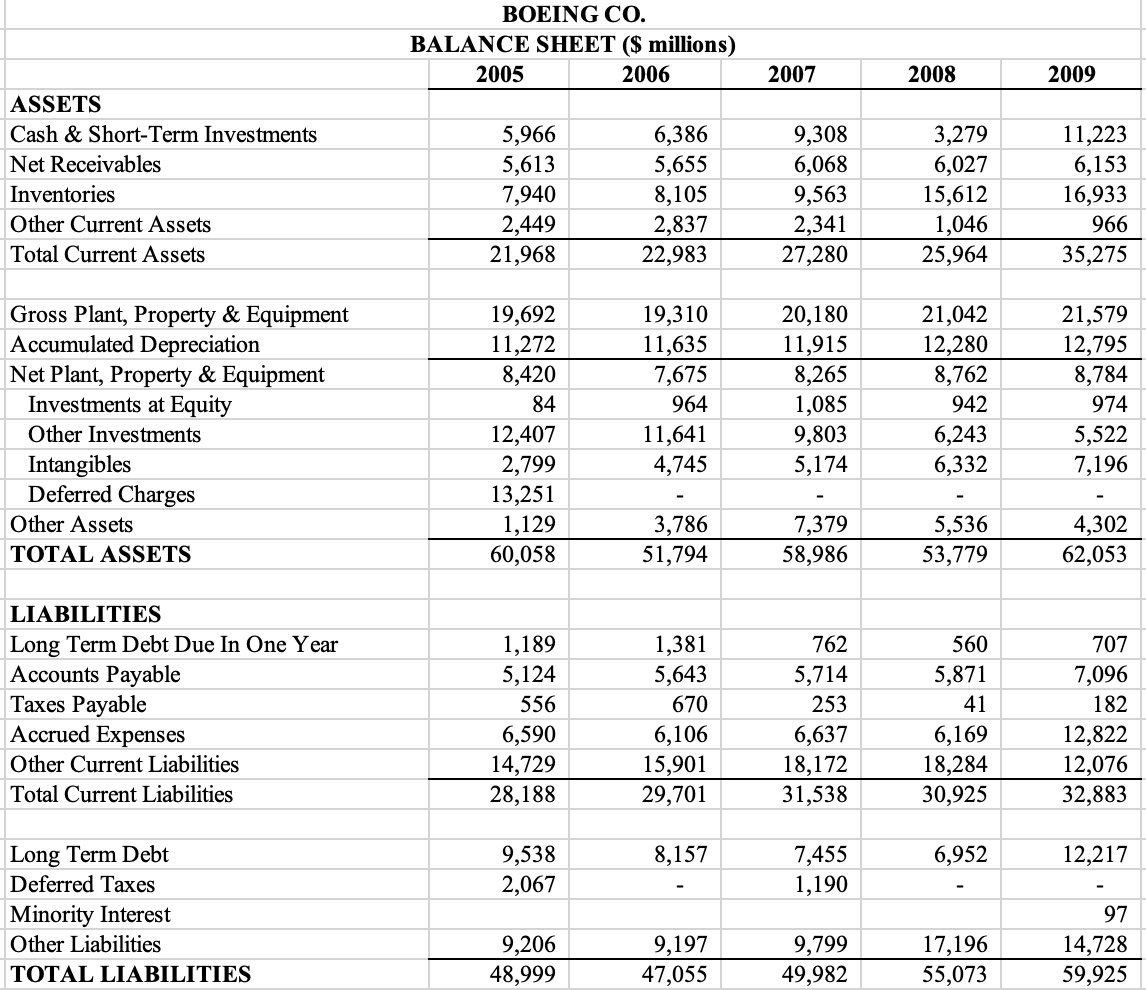
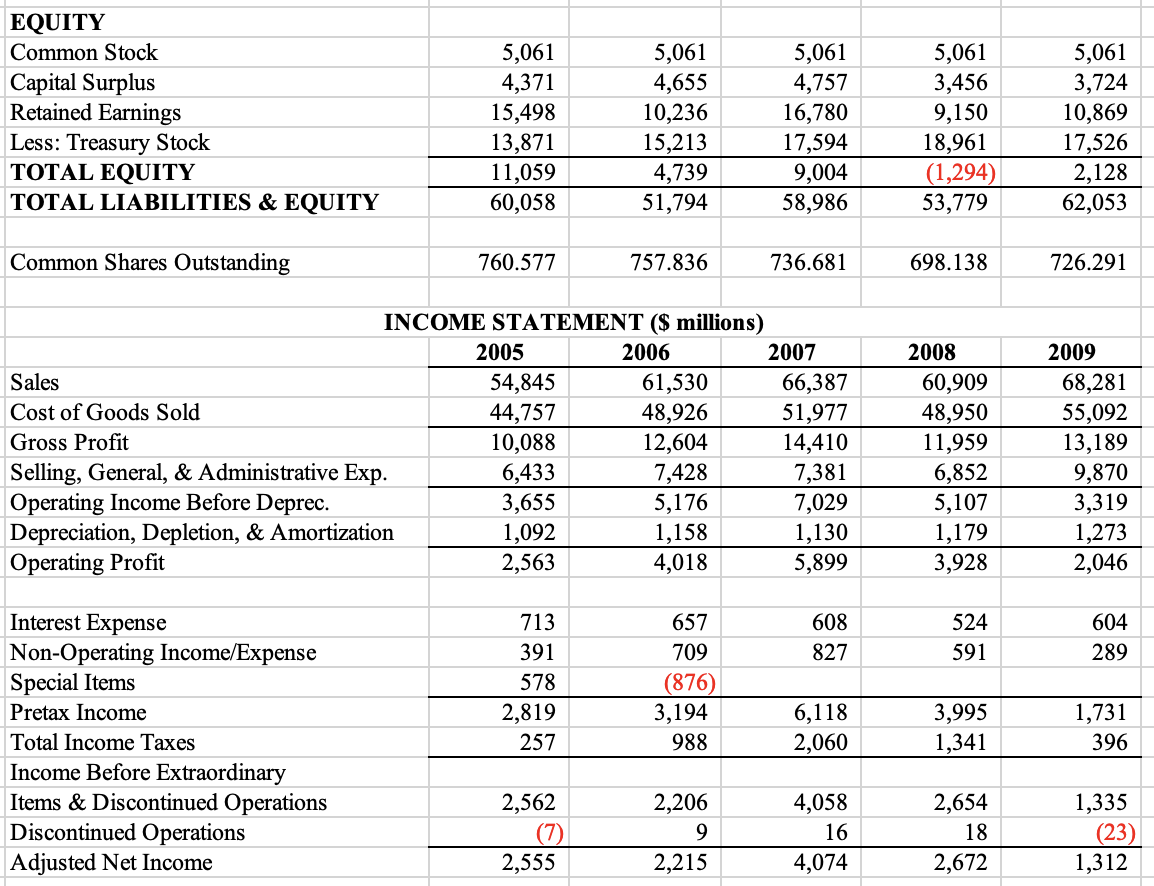
Chapter 2 Problem 15 a. For the years 2005-2009, calculate the following for Boeing: i. Total liabilities-to-equity ratio ii. Times-interest-earned ratio iii. Times-burden-covered ratio b. What percentage decline in earnings before interest and taxes could Boeing have sustained in these years before failing to cover: i. Interest payments? ii. Interest and principal payments? C. What do these calculations suggest about Boeing's financial leverage during this period?ASSETS Cash & Short-Term Investments Net Receivables Inventories Other Current Assets Total Current Assets Gross Plant, Property & Equipment Accumulated Depreciation Net Plant, Property & Equipment Investments at Equity Other Investments Intangibles Deferred Charges Other Assets TOTAL ASSETS LIABILITIES Long Term Debt Due In One Year Accounts Payable Taxes Payable Accrued Expenses Other Current Liabilities Total Current Liabilities Long Term Debt Deferred Taxes Minority Interest Other Liabilities TOTAL LIABILITIES BOEING CO. BALANCE SHEET ($ millions) 2005 2006 5,966 6,386 5,613 5,655 7,940 8,105 2,449 2,837 21,968 22,983 19,692 19,310 11,272 11,635 8,420 7,675 84 964 12,407 11,641 2,799 4,745 13,251 - 1,129 3,786 60,058 51,794 1,189 1,381 5,124 5,643 556 670 6,590 6,106 14,729 15,901 28,188 29,701 9,538 8,157 2,067 - 9,206 9,197 48,999 47,055 200'? 9,308 6,068 9,563 2,341 27,280 20,180 11,915 8,265 1,085 9,803 5,174 7,379 58,986 762 5,714 253 6,637 18,172 31,538 7,455 1,190 9,799 49,982 2008 3,279 6,027 15,612 1,046 25,964 21,042 12,280 8,762 942 6,243 6,332 5,536 53,779 560 5,871 41 6,169 18,284 30,925 6,952 17,196 55,073 2009 11,223 6,153 16,933 966 35,275 21,579 12,795 8,784 974 5,522 7,196 4,302 62,053 707 7,096 182 12,822 12,076 32,883 12,217 97 14,728 59,925 EQUITY Common Stock 5,061 5,061 5,061 Capital Surplus 4,371 4,655 4,757 Retained Earnings 15,498 10,236 16,780 Less: Treasury Stock 13,871 15,213 17,594 TOTAL EQUITY 11,059 4,739 9,004 TOTAL LIABILITIES & EQUITY 60,058 51,794 58,986 Common Shares Outstanding 760.577 757.836 736.681 INCOME STATEMENT ($ millions) 2005 2006 2007 Sales 54,845 61,530 66,387 Cost of Goods Sold 44,757 48,926 51,977 Gross Prot 10,088 12,604 14,410 Selling, General, & Administrative Exp. 6,433 7,428 7,381 Operating Income Before Deprec. 3,655 5,176 7,029 Depreciation, Depletion, & Amortization 1,092 1,158 1,130 Operating Prot 2,563 4,018 5,899 Interest Expense 713 657 608 Non-Operating IncomefExpense 391 709 827 Special Items 578 (876) Pretax Income 2,819 3,194 6,118 Total Income Taxes 257 988 2,060 Income Before Extraordinary Items & Discontinued Operations 2,562 2,206 4,058 Discontinued Operations (7) 9 16 Adjusted Net Income 2,5 5 5 2,215 4,074 5,061 3,456 9,150 18,961 (1,294) 53,779 698.138 2008 60,909 48,950 11,959 6,852 5,107 1,179 3,928 524 591 3,995 1,341 2,654 18 2,672 5,061 3,724 10,869 17,526 2,128 62,053 726.291 2009 68,281 55,092 13,189 9,870 3,319 1,273 2,046 604 289 1,731 396 1,335 (23) 1,312
Step by Step Solution
There are 3 Steps involved in it
1 Expert Approved Answer
Step: 1 Unlock
Question Has Been Solved by an Expert!
Get step-by-step solutions from verified subject matter experts
Step: 2 Unlock
Step: 3 Unlock
Students Have Also Explored These Related Finance Questions!