

Question: Chapter 2. Production Possibilities Frontier (PPF) Framework: Pro-Class 8; III-Class Activities Packet NameI'lD. Number: Section: Date: Part 4. Economic Equations and Graphs Point In cane--
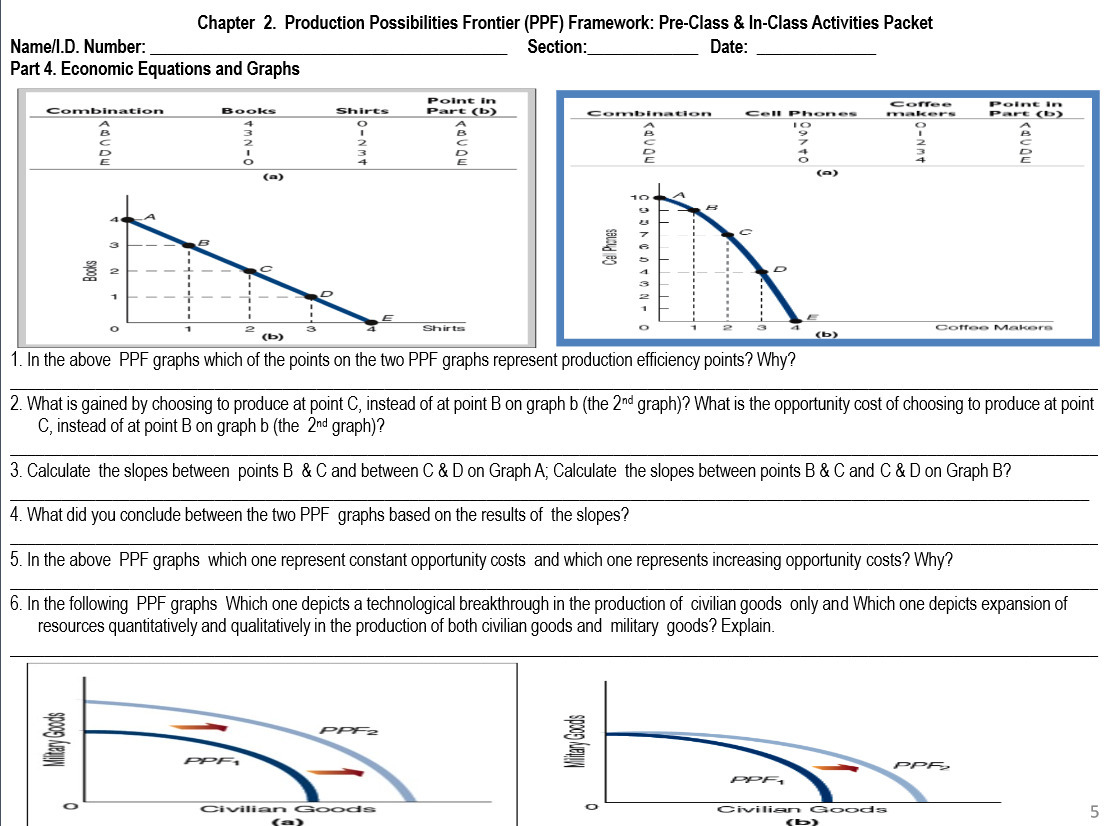
Chapter 2. Production Possibilities Frontier (PPF) Framework: Pro-Class 8; III-Class Activities Packet NameI'lD. Number: Section: Date: Part 4. Economic Equations and Graphs Point In cane-- cEMD'\"\"'\" 3'0'9'\". Sh'". Fm b Gambia-turn 4:." Pinon-- man-nur- A 4 o A A I o o a 3 I B a 9 l c 2 2 c c 7 2 D I 3 D D 4 :I E o 4 E E 0 4 D leltt-UIHICCO 1: In the above PPF graphs which of the points on the two PPF graphs represent production efciency points? Why? 2. What is gained by choosing to produce at point C, instead of at point B on graph b (the 2"\" graph)? What is the opportunity cost of choosing to produce at point C, instead of at point B on graph b [the 2"d graph}? 3. Calculate the slopes between points B 8: C and between C & D on Graph A; Calculate the slopes between points B & C and C 8: D on Graph B? 4. What did you conclude between the two PPF graphs based on the results of the slopes? 5. In the above PPF graphs which one represent constant opportunity costs and which one represents increasing opportunity costs? Why? 6. In the following PPF graphs Which one depicts a technological breakthrough in the production of civilian goods only and Which one depicts expansion of resources quantitatively and qualitatively in the production of both civilian goods and military goods? Explain. 1':- E Fwy-=2 E =5 E -.. PPR. PPF.' a civilian was 0 Civilian Goods 5 (1 (b)
Step by Step Solution
There are 3 Steps involved in it

Get step-by-step solutions from verified subject matter experts