

Question: Chapter 2 Running Case Assignment: Analyzing Financial Performance Software skills: Spreadsheet charts and formulas Business skills: Financial statement analysis As part of your analysis of
Chapter 2 Running Case Assignment: Analyzing Financial Performance Software skills: Spreadsheet charts and formulas Business skills: Financial statement analysis As part of your analysis of the company for management, you have been asked to analyze data on E- Bikes financial performance. Review E-Bikes selected financial and sales data in the Introduction to E-Bikes, which can be found under the link you clicked on to download this document. There you will find E-Bikes income statement and summary balance sheet data from 2018 to 2020, annual sales of E-Bikes models between 2016 and 2020 (measured in units sold), and total domestic versus international sales between 2016 and 2020 (measured in units sold). Use your spreadsheet software to create graphs of E-Bikes sales history from 2016 to 2020 and its domestic versus international sales from 2016 to 2020. Select the type of graph that is most appropriate for presenting the data you are analyzing. Use your spreadsheet software to calculate the gross and net margins in E-Bikes income statements from 2018 to 2020. You can also create graphs showing trends in selected pieces of E-Bikes income statement and balance sheet data if you wish. (You may want to rearrange the historical ordering of the data if you decide to do this.) Prepare an addition to your management report that answers these questions: What is E-Bikes best- and worst-performing products? What is the proportion of domestic to international sales? Have international sales grown relative to domestic sales? Are sales (revenues) growing steadily, and, if so, at what rate? What is the cost of goods sold compared to revenues? Is it increasing or decreasing? Are the firms gross and net margins increasing or decreasing? Are the firms operating expenses increasing or decreasing? Is the firm heavily in debt? Does it have assets to pay for expenses and to finance the development of new products and information systems? Use your PowerPoint presentation software to summarize your analysis of E- Bikes performance for management. You can either copy and paste your spreadsheet data or embed it, whichever is easier. 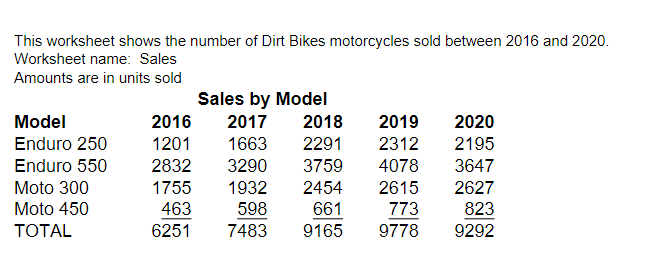
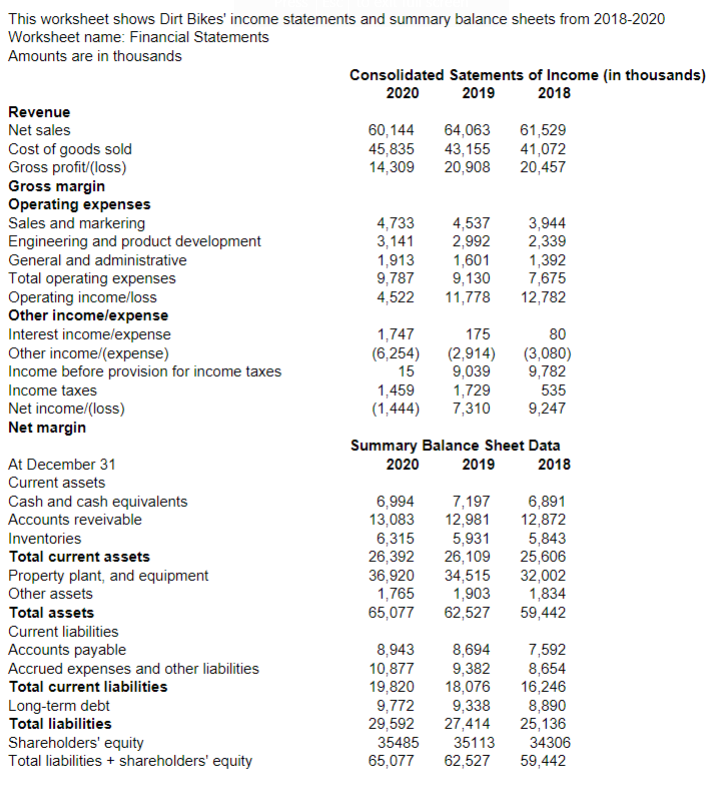
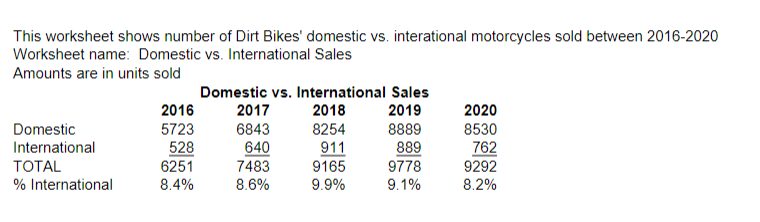
This worksheet shows the number of Dirt Bikes motorcycles sold between 2016 and 2020 . Worksheet name: Sales Amounts are in units sold This worksheet shows Dirt Bikes' income statements and summary balance sheets from 2018-2020 This worksheet shows number of Dirt Bikes' domestic vs. interational motorcycles sold between 2016-2020 Worksheet name: Domestic vs. International Sales Amounts are in units sold This worksheet shows the number of Dirt Bikes motorcycles sold between 2016 and 2020 . Worksheet name: Sales Amounts are in units sold This worksheet shows Dirt Bikes' income statements and summary balance sheets from 2018-2020 This worksheet shows number of Dirt Bikes' domestic vs. interational motorcycles sold between 2016-2020 Worksheet name: Domestic vs. International Sales Amounts are in units sold
Step by Step Solution
There are 3 Steps involved in it

Get step-by-step solutions from verified subject matter experts