

Question: Chapter 2 Stem & Leaf and Histograms Progress saved Done Score: 3/22 6/22 answered Question 1 0/1 pt 9 3 99 0 Details The stem-and-leaf


![Actuaries. Array Hint: Help 23' Video [3 [+] Score on last try:](https://s3.amazonaws.com/si.experts.images/answers/2024/06/6667fa537390d_3236667fa534743c.jpg)
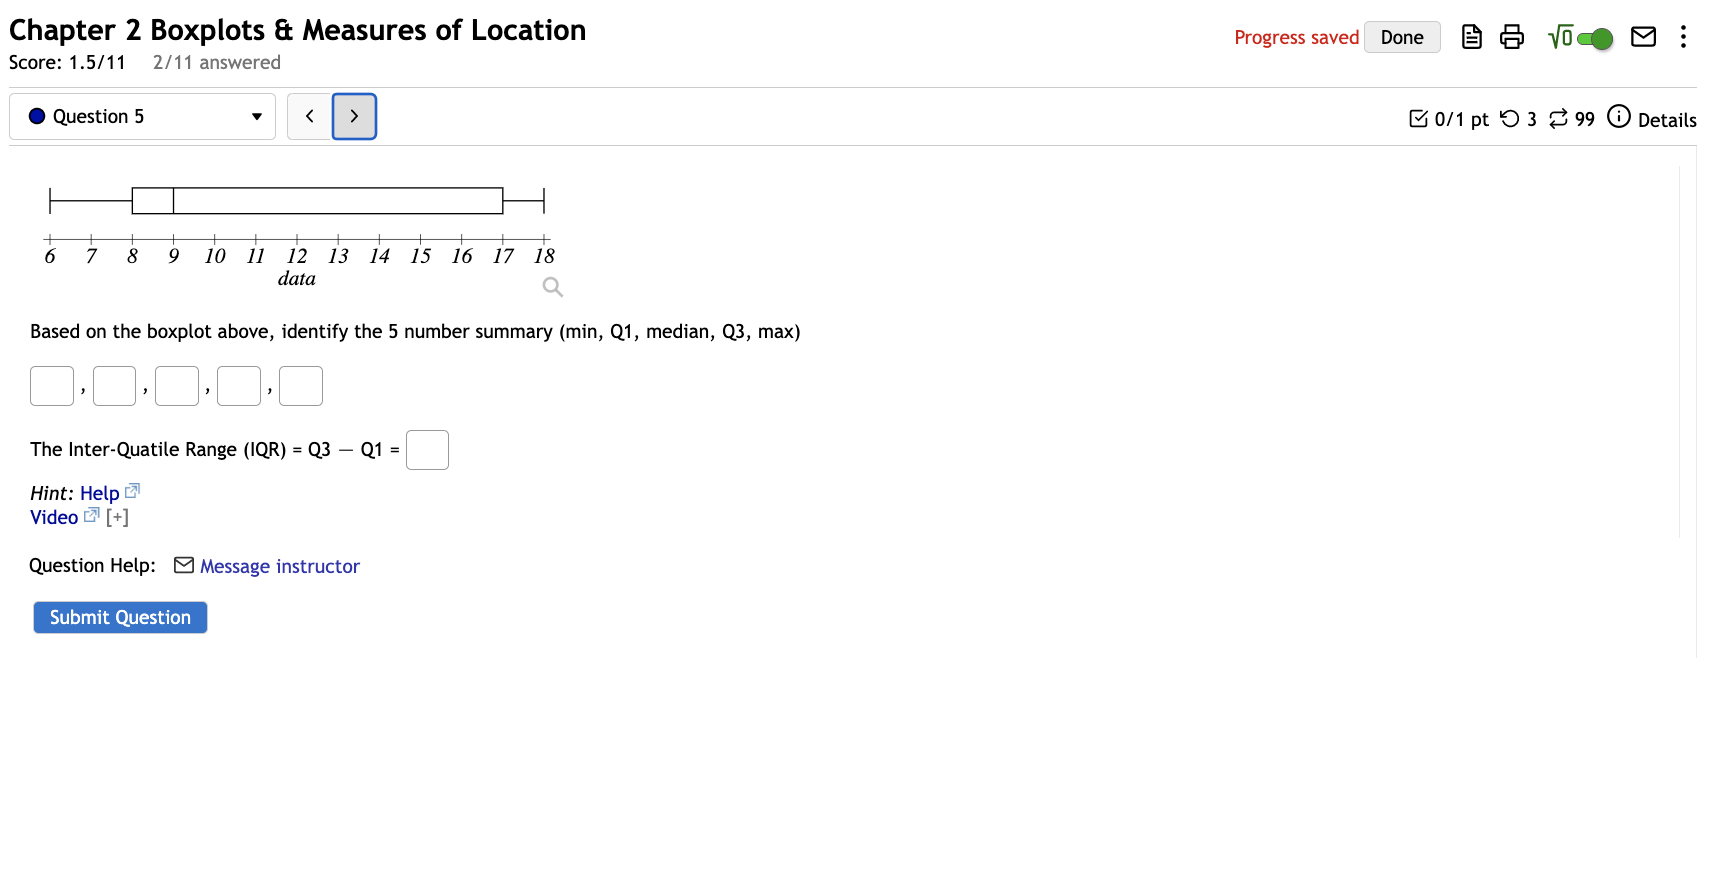

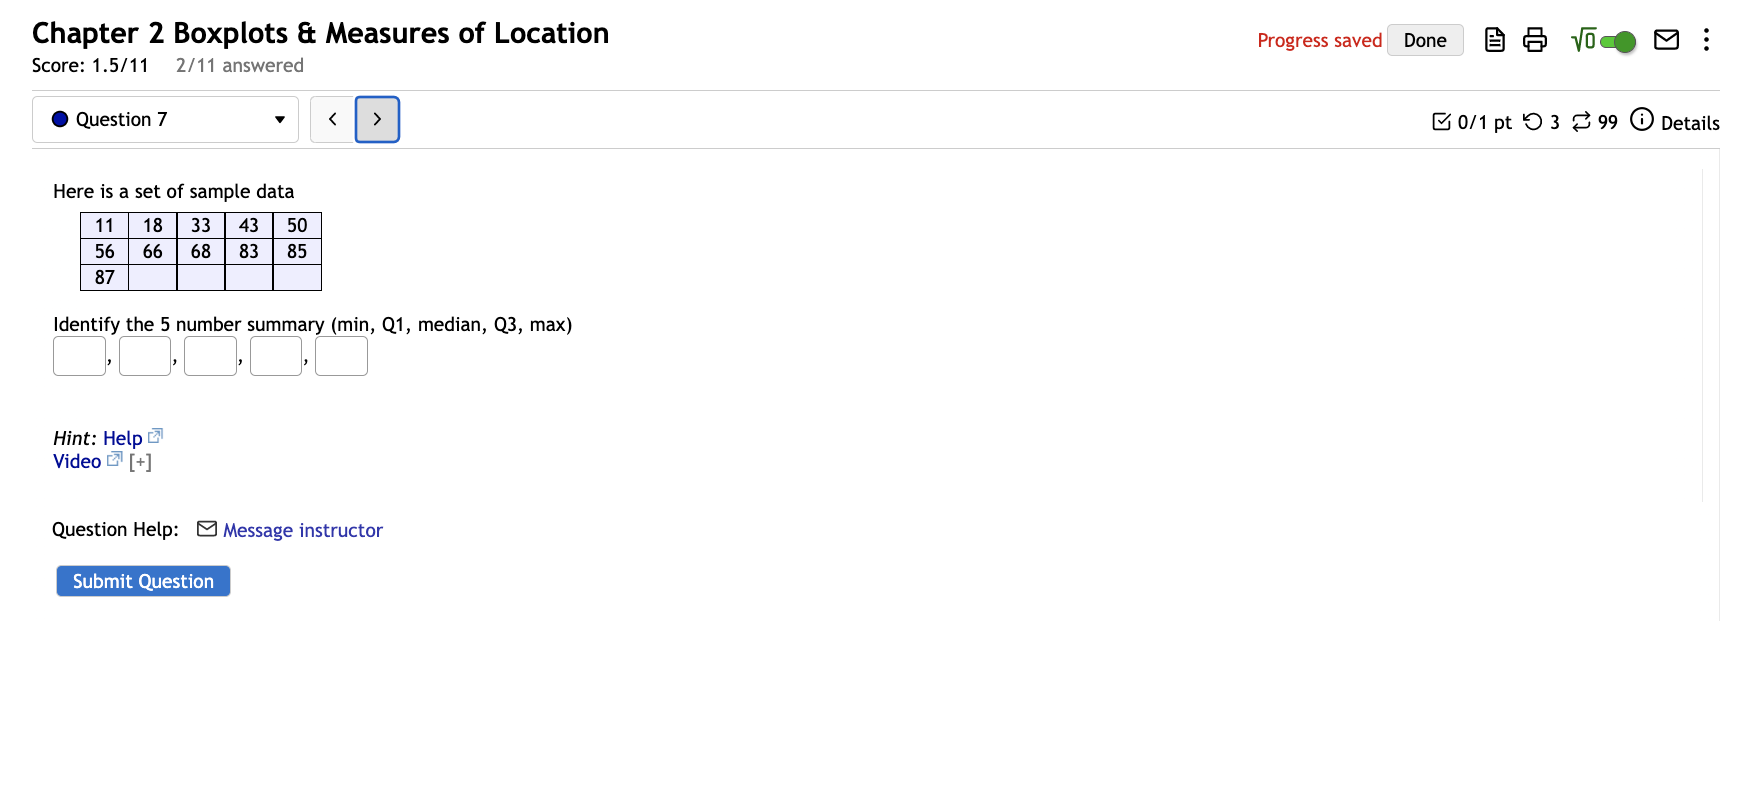
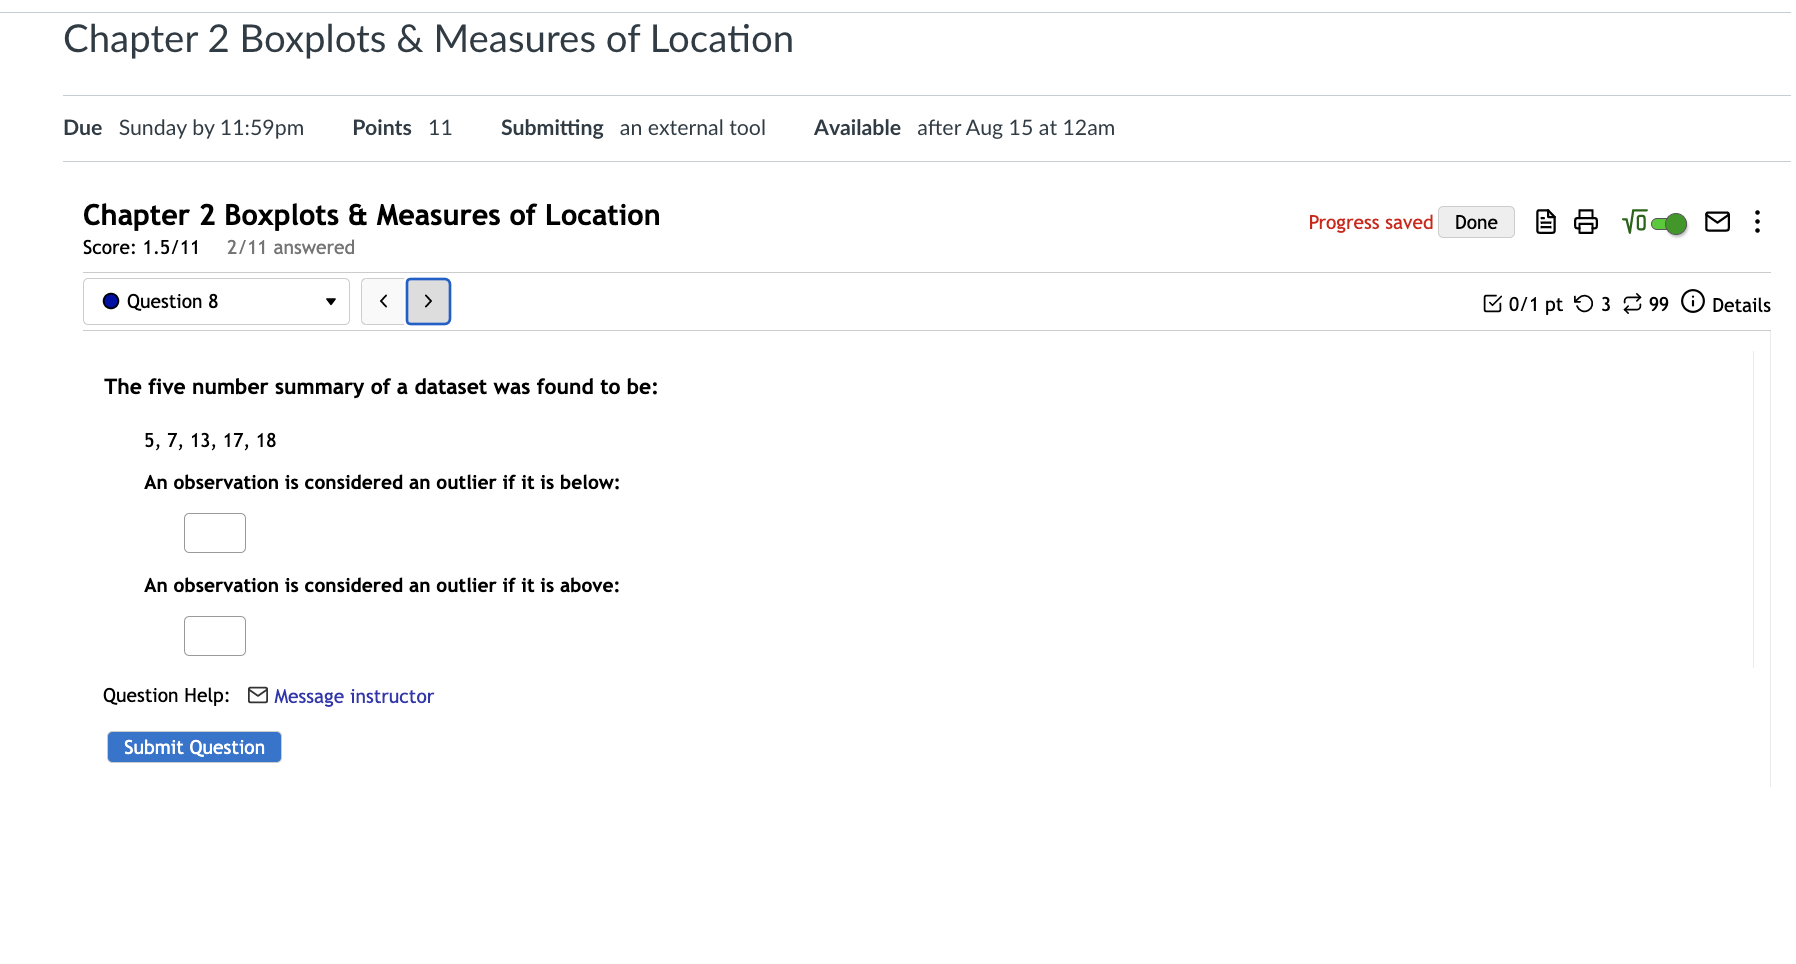

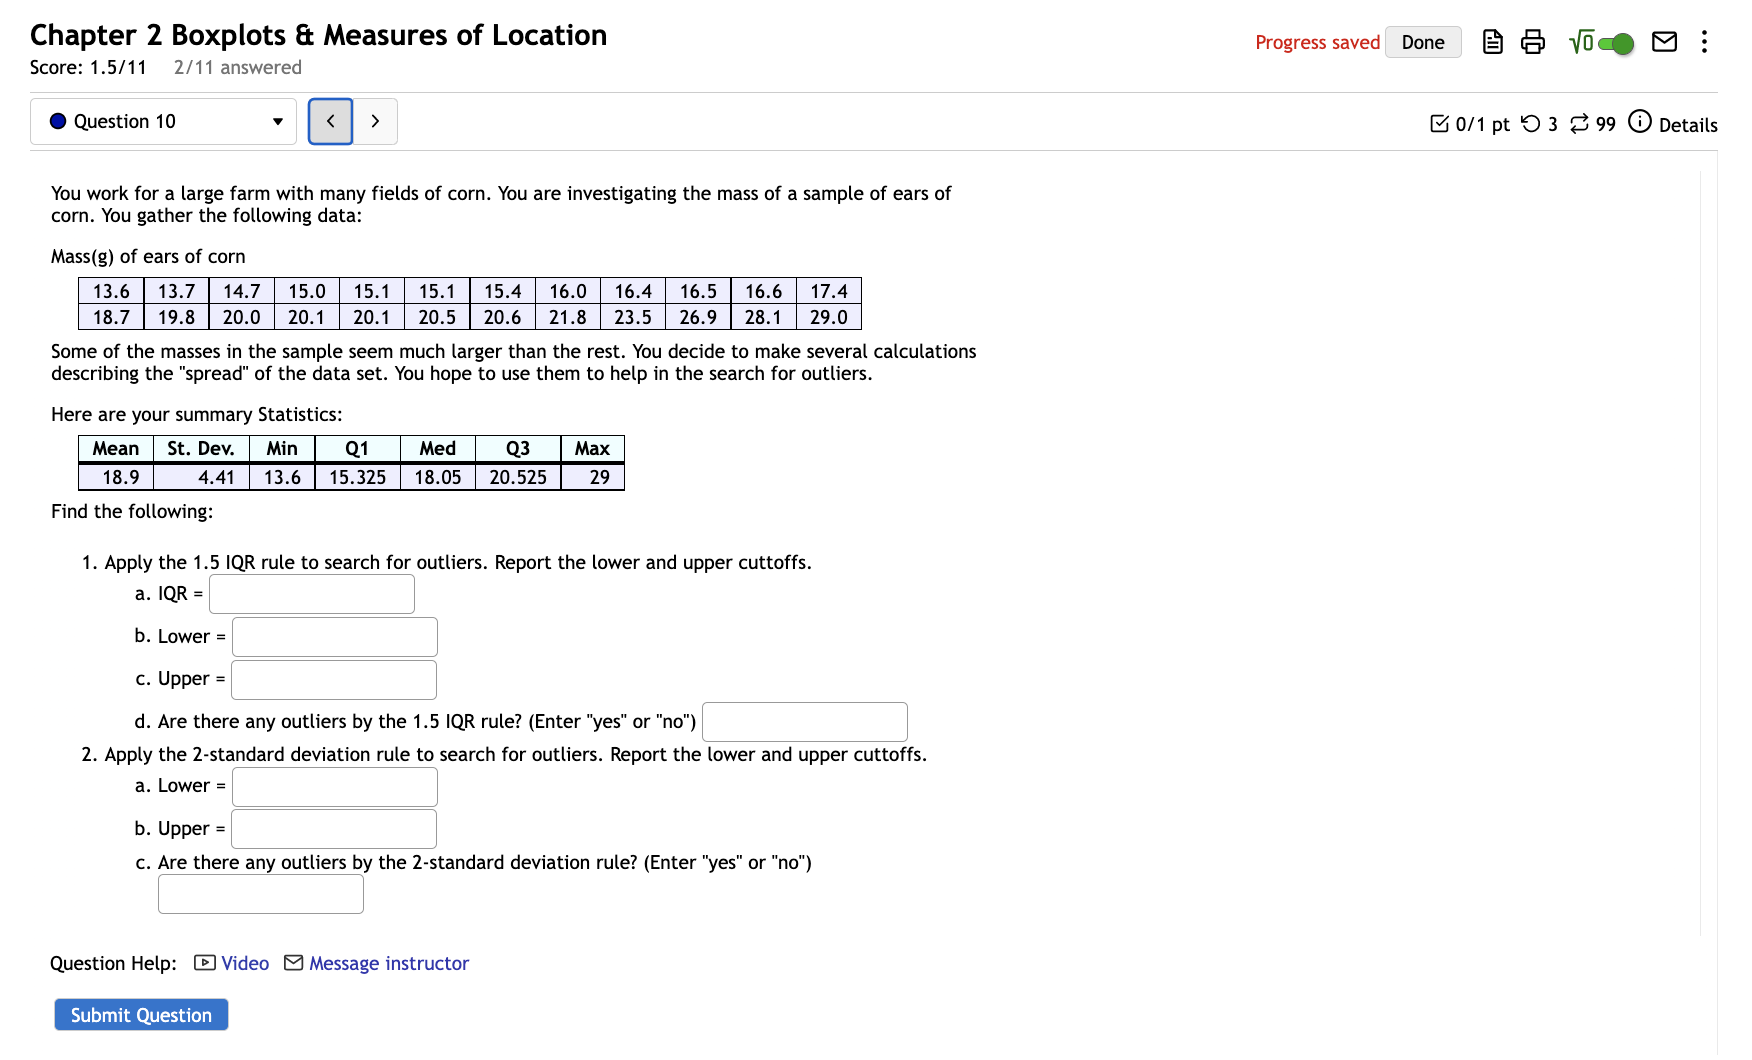

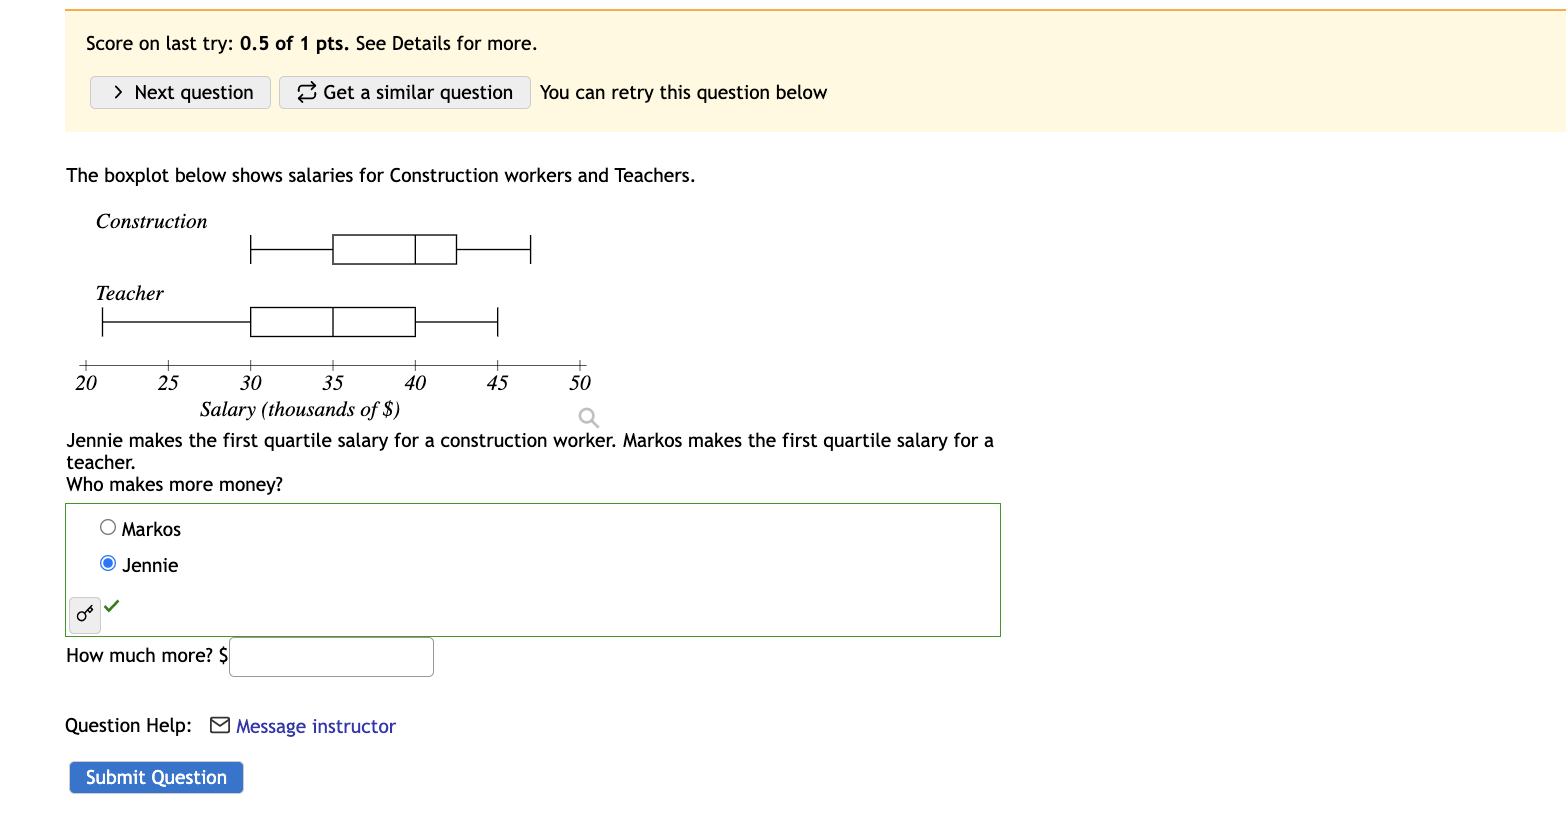
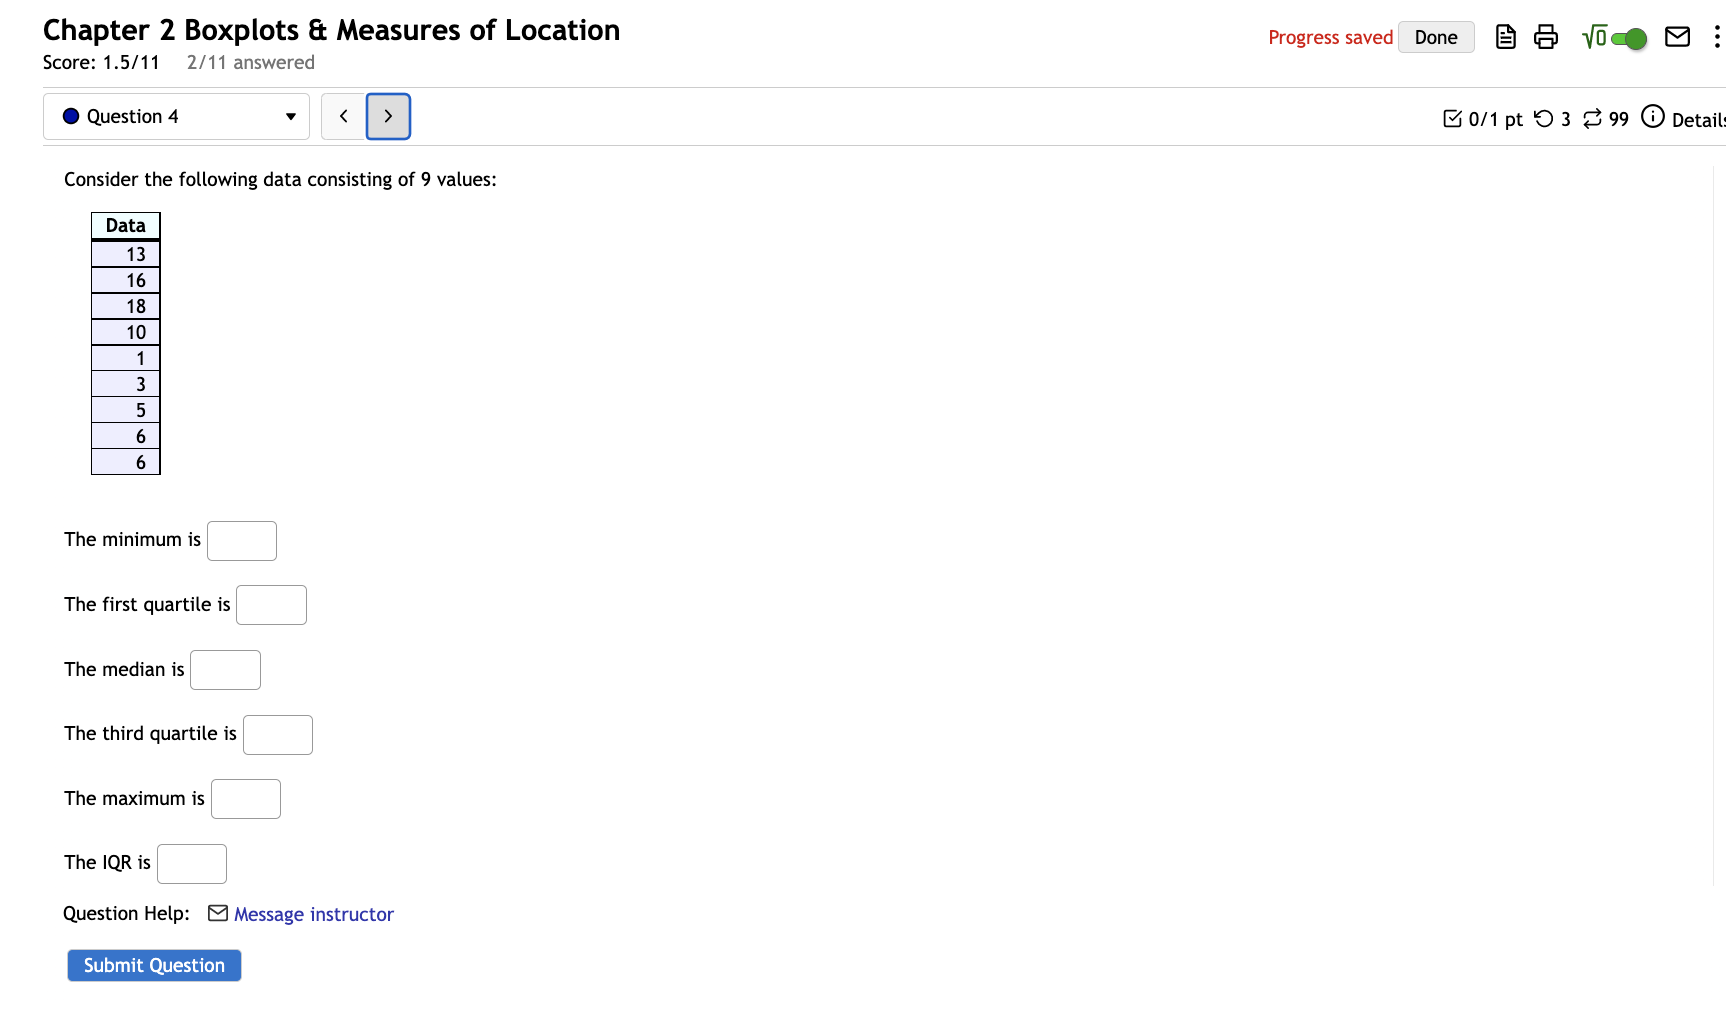
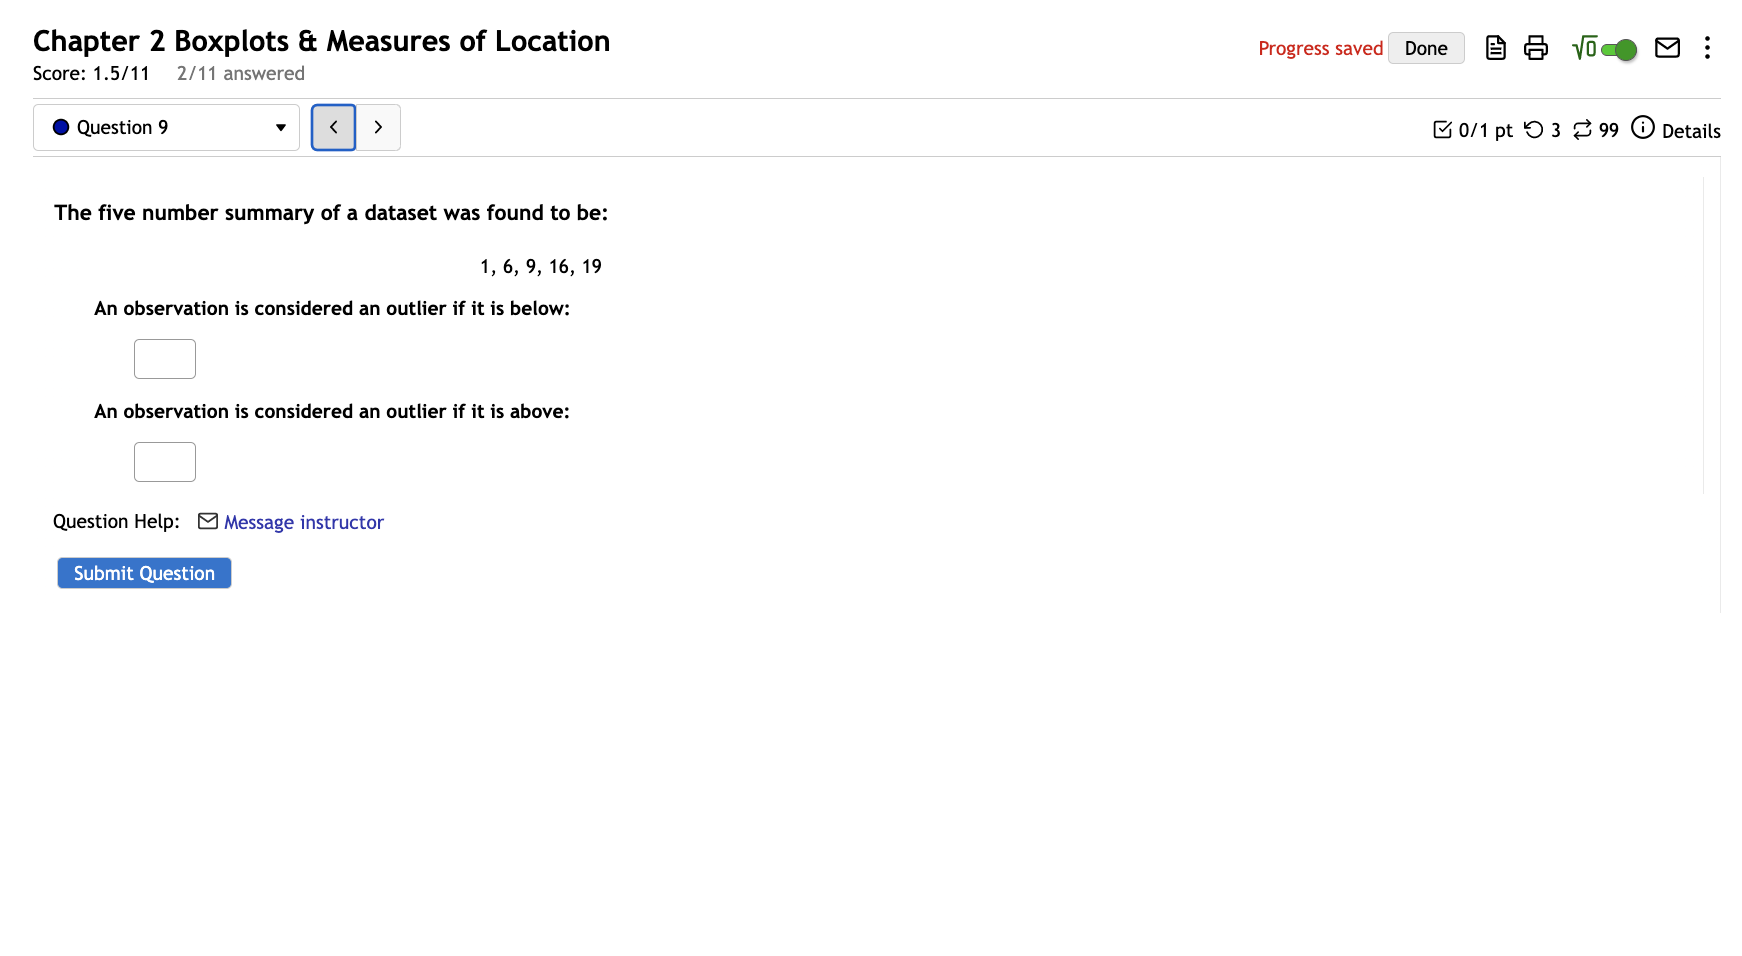
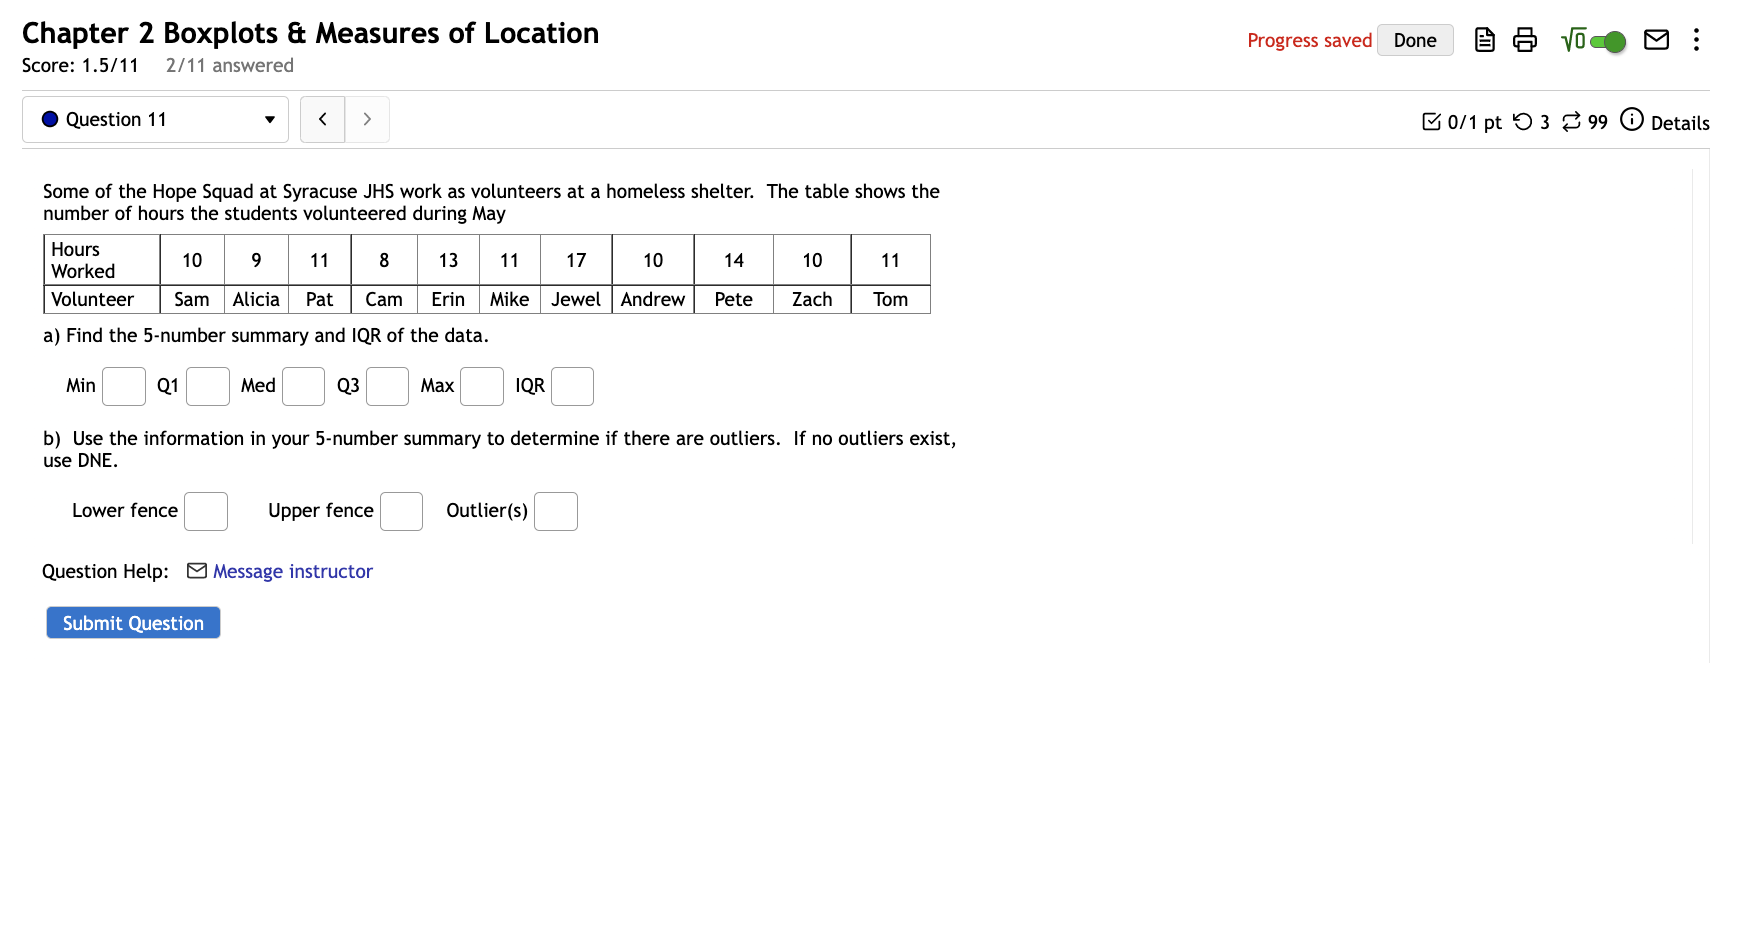
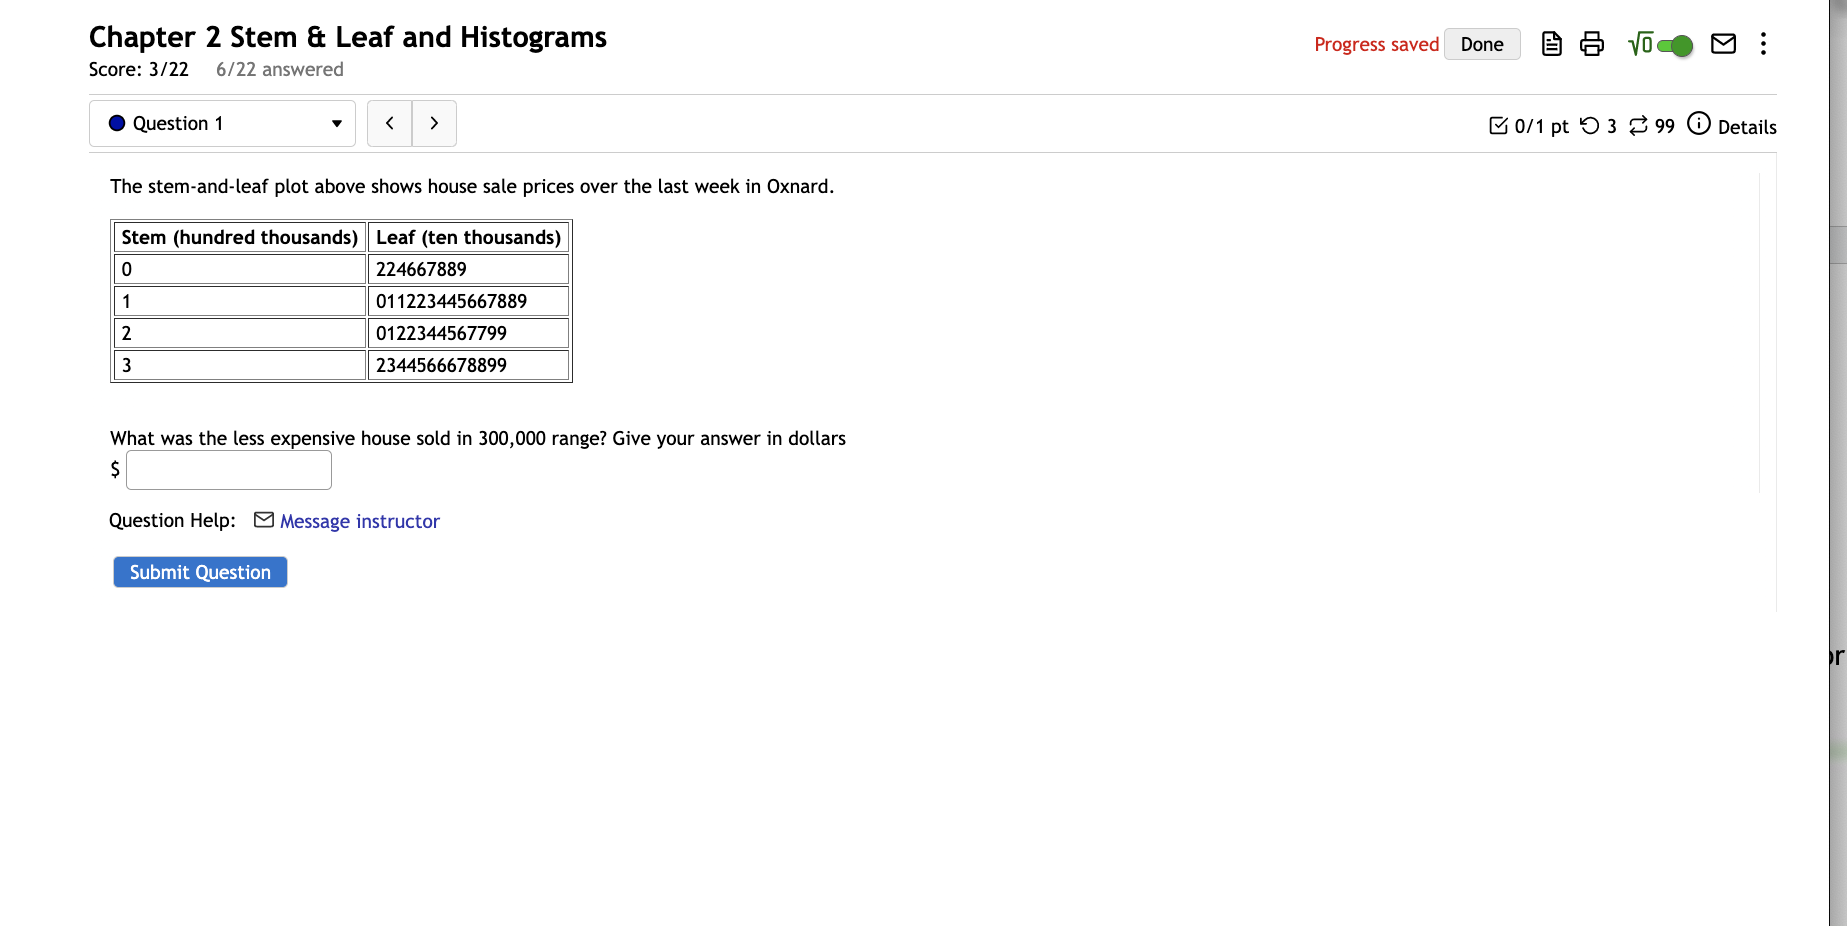
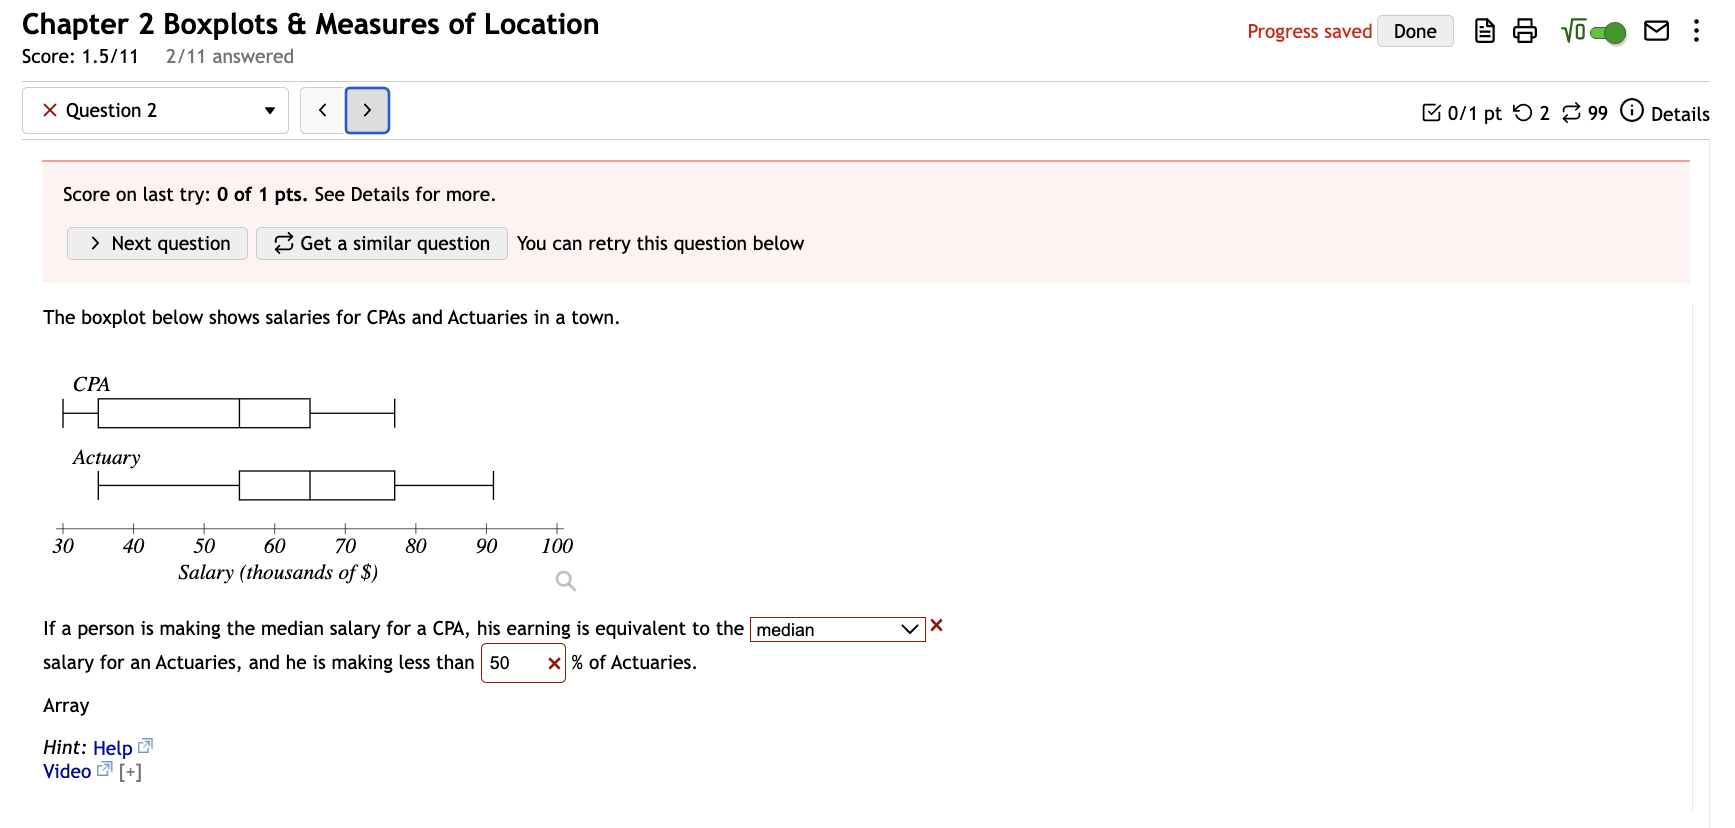
Chapter 2 Stem & Leaf and Histograms Progress saved Done Score: 3/22 6/22 answered Question 1 0/1 pt 9 3 99 0 Details The stem-and-leaf plot above shows house sale prices over the last week in Oxnard. Stem (hundred thousands) Leaf (ten thousands) 0 224667889 1 011223445667889 2 0122344567799 3 2344566678899 What was the less expensive house sold in 300,000 range? Give your answer in dollars $ Question Help: Message instructor Submit QuestionChapter 2 Boxplots & Measures of Location progresssmd Done lg a, 15.. E Score: 1.5/11 2f11 answered x Questionz v Next question '3 Get a similar question You can retry this question below The boxplot below shows salaries for CPAs and Actuaries in a town. I v' | v' I 30 40 50 60 70 80 90 100 Salary (thousands of 3) q If a person is making the median salary for a CPA, his earning is equivalent to the median v X salary for an Actuaries, and he is making less than 96 of Actuaries. Array Hint: Help 23' Video [3 [+] Score on last try: 0.5 of 1 pts. See Details for more. > Next question Get a similar question You can retry this question below The boxplot below shows salaries for Construction workers and Teachers. Construction Teacher 20 25 30 35 40 45 50 Salary (thousands of $) Q Jennie makes the first quartile salary for a construction worker. Markos makes the first quartile salary for a teacher. Who makes more money? O Markos O Jennie How much more? $ Question Help: Message instructor Submit QuestionChapter 2 Boxplots & Measures of Location Progress saved Done Score: 1.5/11 2/11 answered Question 4 > 0/1 pt 9 3 99 0 Detail Consider the following data consisting of 9 values: Data 13 16 18 10 1 3 5 6 The minimum is The first quartile is The median is The third quartile is The maximum is The IQR is Question Help: Message instructor Submit QuestionChapter 2 Boxplots & Measures of Location Progress saved Done G 6 0 0 : Score: 1.5/11 2/11 answered . Question 5 0/1 pt 9 3 99 0 Details 6 7 8 9 10 11 12 13 14 15 16 17 18 data Q Based on the boxplot above, identify the 5 number summary (min, Q1, median, Q3, max) The Inter-Quatile Range (IQR) = Q3 - Q1 = Hint: Help Video _ [+] Question Help: Message instructor Submit QuestionChapter 2 Boxplots & Measures of Location Progress saved Done ... Score: 1.5/11 2/11 answered Question 6 0/1 pt 9 3 99 0 Details 8 9 10 11 12 13 14 15 16 17 18 19 20 data Q Based on the boxplot above, identify the 5 number summary Question Help: Video Message instructor Submit QuestionChapter 2 Boxplots & Measures of Location Progress saved Done Score: 1.5/11 2/11 answered . Question 7 0/1 pt 9 3 99 0 Details Here is a set of sample data 11 18 33 43 50 56 66 68 83 85 87 Identify the 5 number summary (min, Q1, median, Q3, max) Hint: Help Video _ [+] Question Help: Message instructor Submit QuestionChapter 2 Boxplots & Measures of Location Due Sunday by 11:59pm Points 11 Submitting an external tool Available after Aug 15 at 12am Chapter 2 Boxplots & Measures of Location Progress saved Done la En e. B 3 Score: 1.5.111 2111 answered .Questions v You work for a large farm with many fields of corn. You are investigating the mass of a sample of ears of corn. You gather the following data: Mass(g) of ears of corn 13.6 13.7 14.7 15.0 15.1 15.1 15.4 16.0 16.4 16.5 16.6 17.4 18.7 19.8 20.0 20.1 20.1 20.5 20.6 21.8 23.5 26.9 28.1 29.0 Some of the masses in the sample seem much larger than the rest. You decide to make several calculations describing the "spread" of the data set. You hope to use them to help in the search for outliers. Here are your summary Statistics: Mean St, Dev. Min Q1 Med Q3 Max 18.9 4.41 13.6 15.325 18.05 20.525 29 Find the following: 1. Apply the 1.5 IQR rule to search for outliers. Report the lower and upper cuttoffs. a. IQR = d. Are there any outliers by the 1.5 IQR rule? (Enter "yes" or "no") :] 2. Apply the Z-standard deviation rule to search for outliers. Report the lower and upper cuttoffs. c. Are there any outliers by the Z-standard deviation rule? (Enter "yes" or "no") :1 Question Help: El Video 8 Message instructor Submit Question Progress saved Done IQ IE! 40' B Ban pt '03 299 Details Chapter 2 Boxplots & Measures of Location Progress saved Done Score: 1.5/11 2/11 answered Question 11 0/1 pt 9 3 99 0 Details Some of the Hope Squad at Syracuse JHS work as volunteers at a homeless shelter. The table shows the number of hours the students volunteered during May Hours 10 9 11 8 13 11 17 10 14 10 11 Worked Volunteer Sam Alicia Pat Cam Erin Mike Jewel Andrew Pete Zach Tom a) Find the 5-number summary and IQR of the data. Min Q1 Med Q3 Max IQR b) Use the information in your 5-number summary to determine if there are outliers. If no outliers exist, use DNE. Lower fence Upper fence Outlier(s) Question Help: Message instructor Submit
Step by Step Solution
There are 3 Steps involved in it

Get step-by-step solutions from verified subject matter experts