

Question: CHAPTER 3: WORKING WITH FINANCIAL STATEMENTS Assignment 1 1. Michigan Corp. has prepared the following financial statements: Michigan Corp Income Statement For the Year Ended
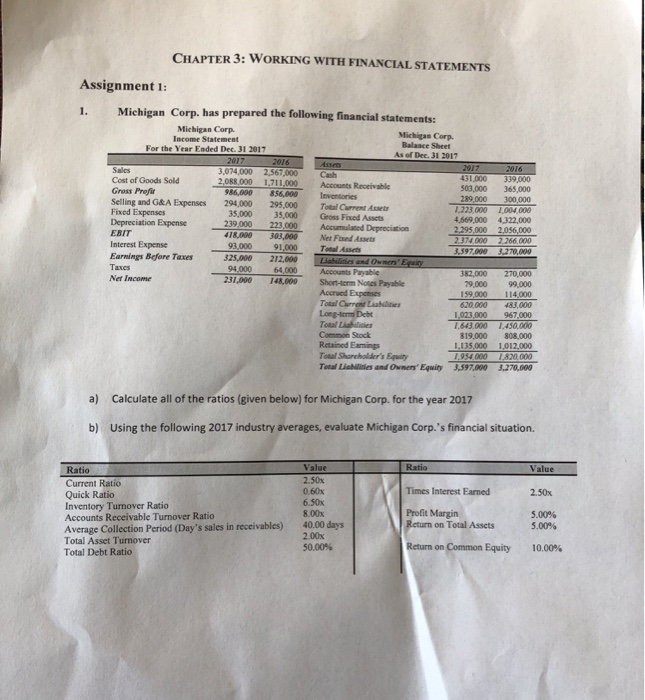
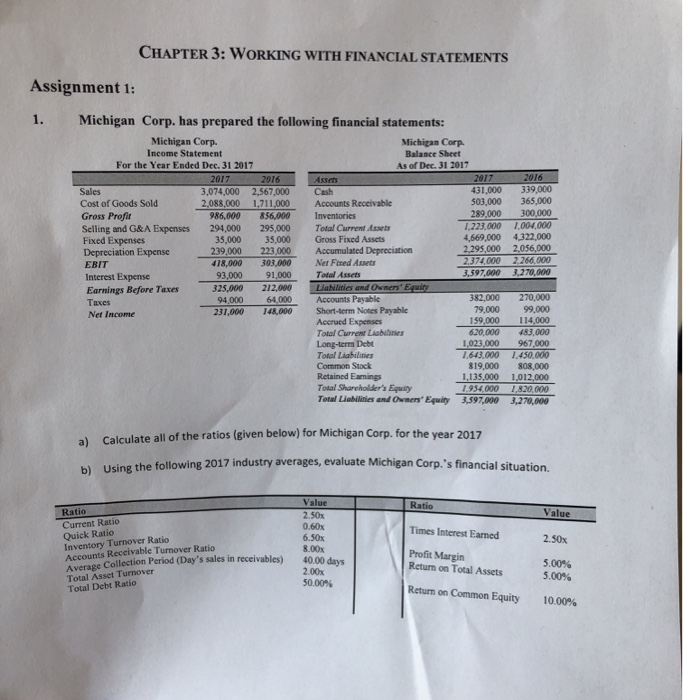
CHAPTER 3: WORKING WITH FINANCIAL STATEMENTS Assignment 1 1. Michigan Corp. has prepared the following financial statements: Michigan Corp Income Statement For the Year Ended Dec. 31 2017 Michigan Corp. Balasce Sheet As of Dec.31 2017 3,074,000 2,567,000 Csh 2,088.000 1.711.000 Accounts Receivable 31,000 339,00 03,000 365,000 Cost of Goods Sold Gross Prefir Selling and G&A Expenses 294,000 295,000 Fixed Expenses Depreciation Expense EBIT Interest Expense Earnings Before Taxes3 Taxes Net Income 986,000 856,000 Inventories 289,000 300,000 223,000 1,004.000 4,669,000 4,322,000 Total Current Assets 35,000 35,000 Gross Fixed Assets 239,000 223,000 Accumulated Depreciation 418,000 303,000 Net Fioxed Assets 93,000 91000 ta Asse ,597,000 3,270,000 325,000 212000 94,000 64,000 82,000 270,000 9,00099,000 59,000 114,000 620.000 483,000 1.023,000 967,000 1.643.000 1450,000 819,000 808,000 135,000 1012,000 1934.000 1820.000 Total Liabilinies and Owners Eqwity 3597,000 3,270,000 231,000 148,000Shor-term Notcs Payabe Accrued Expenses Total Total Liabliies Common Stock Retained Eamings Total Shareholder's Equity a) Calculate all of the ratios (given below) for Michigan Corp. for the year 2017 b) Using the following 2017 industry averages, evaluate Michigan Corp.'s financial situation. Ratio Ratio Current Ratio Quick Ratio Inventory Turnover Ratio Accounts Receivable Turnover Ratio Average Collection Period (Day's sales in receivables) Total Asset Turnover Total Debt Ratio Value 2.50x 0.60x 6.50x 8.00x Times Interest Earned 2.50x Profit Margin Return on Total Assets Return on Common Equity 5.00% 5.00% 40.00 days 2.00x 50.00% 10.00% CHAPTER 3: WORKING WITH FINANCIAL STATEMENTS Assignment 1: 1. Michigan Corp. has prepared the following financial statements: Michigan Corp. Income Statement For the Year Ended Dec. 31 2017 Michigan Corp. Balance Sheet As of Dec. 31 2017 2017 3,074,000 2,567,000 Cash 2,088,000 1,711,000 Accounts Receivable 2016 2016 31,000 339,000 503,000 365,000 289,000 300,000 223,000 1,004,000 4,669,000 4,322,000 2,295,000 2,056,000 266,000 ,597,000 3,270,000 Cost of Goods Sold Gross Profit Selling and G&A Expenses Fixed Expenses Depreciation Expense EBIT Interest Expense Earnings Before Taxes Taxes Net Income 986,000 856,000 294,000 295,000 Total Current Assets Inventories 35,000 35,000 Gross Fixed Assets 239,000 223,000 Accumulated Depreciation 418,000 303,000 Ner Ftxed Asets 93,000 91,000Totlsses 382,000 270,000 79,000 99,000 159,000 4,000 620,000 483,000 1,023,000 967,000 1,643 000 1450.000 819,000 808,000 1,135,000 1,012,000 934,000 1,820000 Total Liabilinies and Owners Equity 3,597,000 3,270,000 94,000 64,000 Accounts Payable 231,000 148,000 Short-serm Notes Payable Accrued Expenses Total Current Lisbilanies Long-tera Debt Total Liabilinies Common Stock Retained Earmings Total Shareholder's Equity Calculate all of the ratios (given below) for Michigan Corp. for the year 2017 Using the following 2017 industry averages, evaluate Michigan Corp.'s financial situation. a) bl Value 2.50x 0.60x 6.50x 8.00x Ratio Ratio Current Ratio Quick Ratio Inventory Turnover Ratio Accounts Receivable Turnover Ratio Average Collection Period (Day's sales in receivables) Total Asset Turnover Total Debt Ratio Value Times Interest Earmed 2.50x Profit Margin Return on Total Assets 4000 days 5.00% 5.00% 10.00% 2.00x 50.00% Return on Common Equity
Step by Step Solution
There are 3 Steps involved in it

Get step-by-step solutions from verified subject matter experts