

Question: Chapter 3's Classwork: Show work neatly, clearly and in pencil. Math 54 Name Measures of the Center Instructor Date 1. The following data set represents
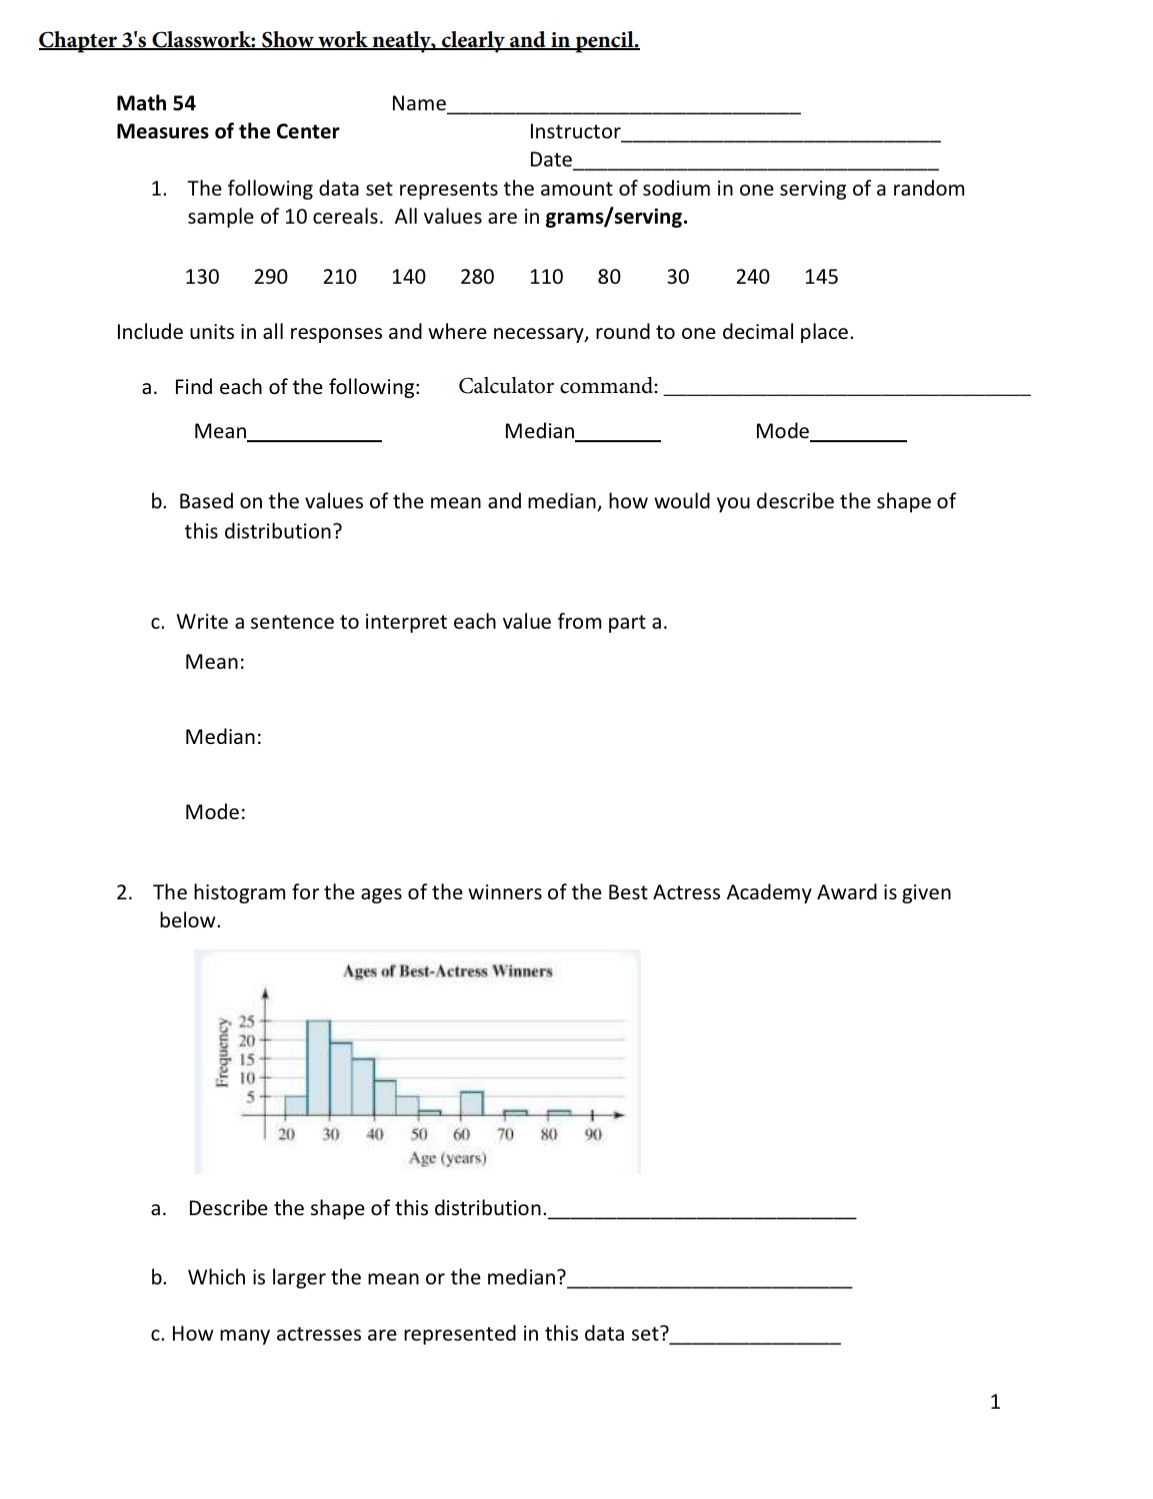
Chapter 3's Classwork: Show work neatly, clearly and in pencil. Math 54 Name Measures of the Center Instructor Date 1. The following data set represents the amount of sodium in one serving of a random sample of 10 cereals. All values are in grams/serving. 130 290 210 140 280 110 80 30 240 145 Include units in all responses and where necessary, round to one decimal place. a. Find each of the following: Calculator command: Mean Median Mode b. Based on the values of the mean and median, how would you describe the shape of this distribution? . Write a sentence to interpret each value from part a. Mean: Median: Mode: 2. The histogram for the ages of the winners of the Best Actress Academy Award is given below. Ages of Best- Actress Winners 20+ 151 10+ I_, 54 e ) | L jun m _ = 20 30 40 500 o) 70 sl %) Frequency Age (years) a. Describe the shape of this distribution. b. Which is larger the mean or the median? . How many actresses are represented in this data set
Step by Step Solution
There are 3 Steps involved in it

Get step-by-step solutions from verified subject matter experts