

Question: Chapter 4, Section 4.7, Question 006 The following table shows the total sales, in thousands, since a new game was brought to market. Month Sales
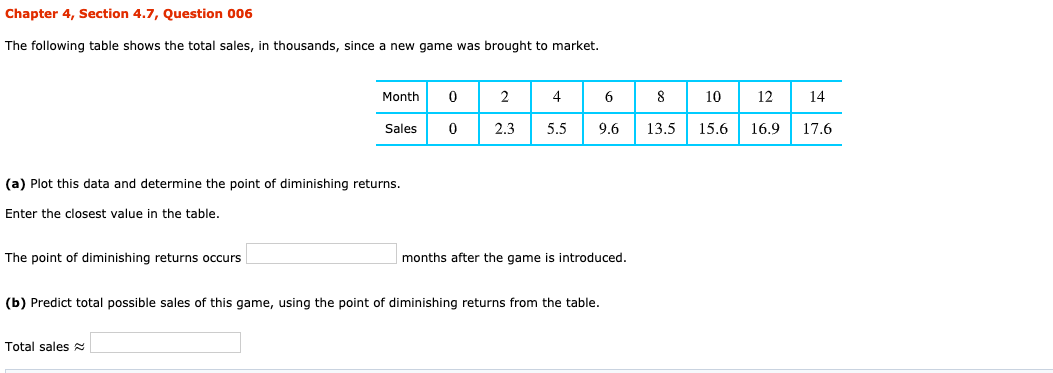
Chapter 4, Section 4.7, Question 006 The following table shows the total sales, in thousands, since a new game was brought to market. Month Sales 0 0 2 2.3 4 5.5 6 8 10 12 14 9.6 | 13.5 | 15.6 | 16.9 | 17.6 (a) Plot this data and determine the point of diminishing returns. Enter the closest value in the table. The point of diminishing returns occurs months after the game is introduced. (b) Predict total possible sales of this game, using the point of diminishing returns from the table. Total sales
Step by Step Solution
There are 3 Steps involved in it
1 Expert Approved Answer
Step: 1 Unlock

Question Has Been Solved by an Expert!
Get step-by-step solutions from verified subject matter experts
Step: 2 Unlock
Step: 3 Unlock