

Question: Chapter 4: What Can We Learn from an Equation? 4.3: Modeling Real-World Data Learning Objectives Together with your team: e Use the best-fit model from
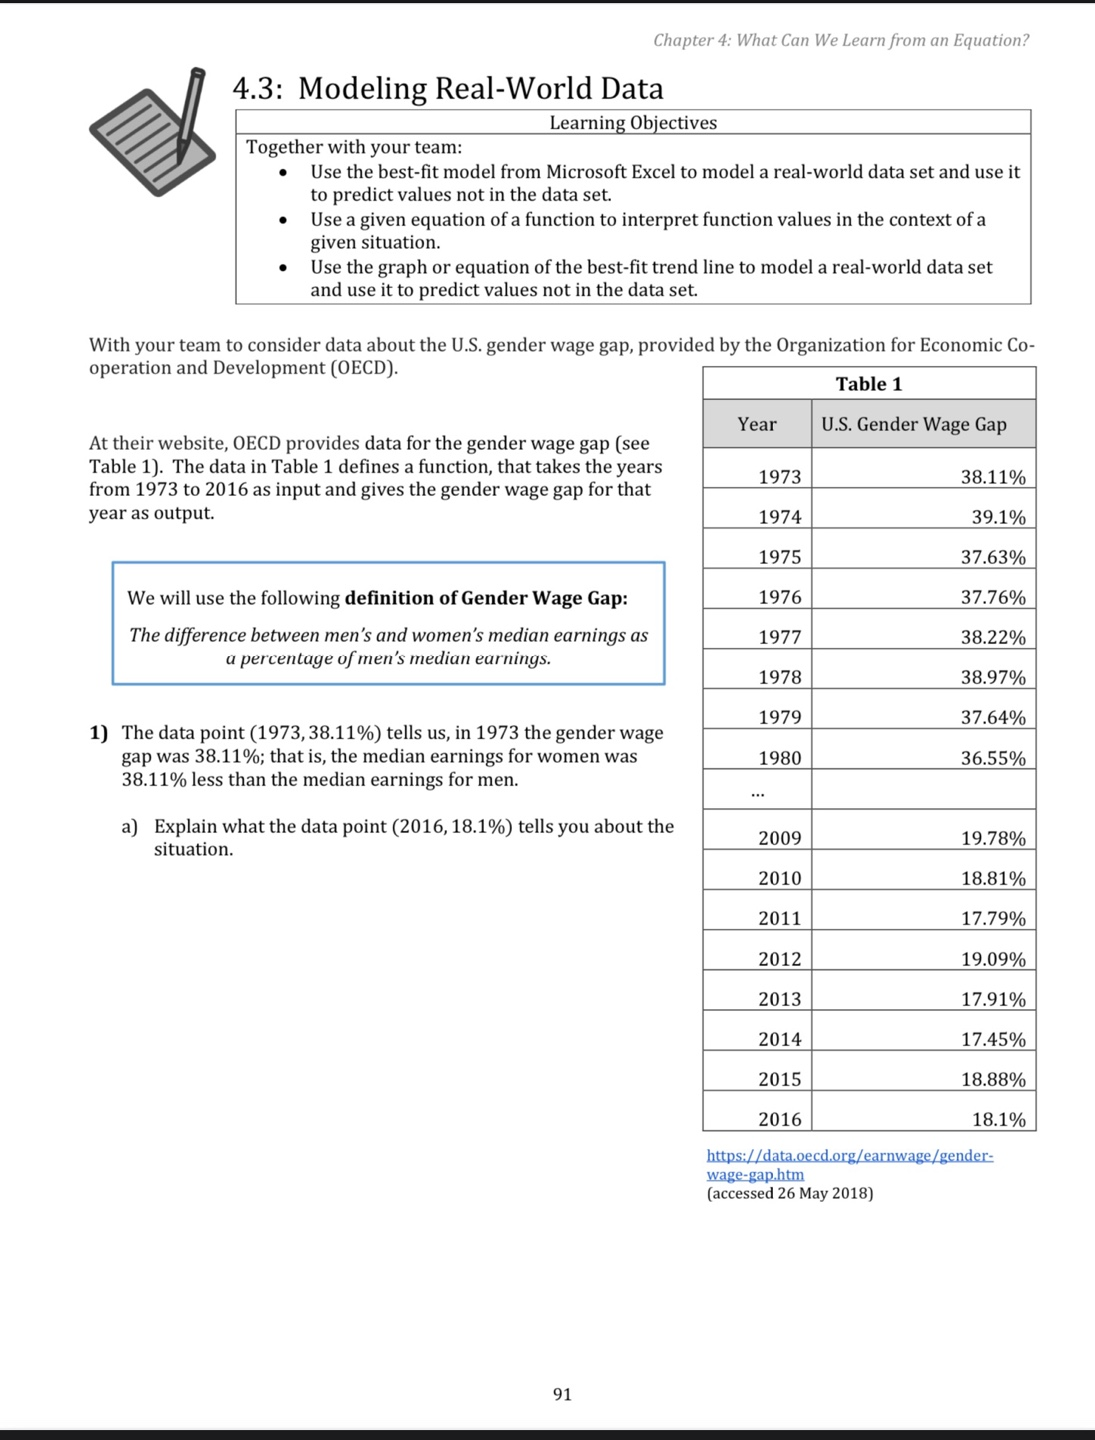
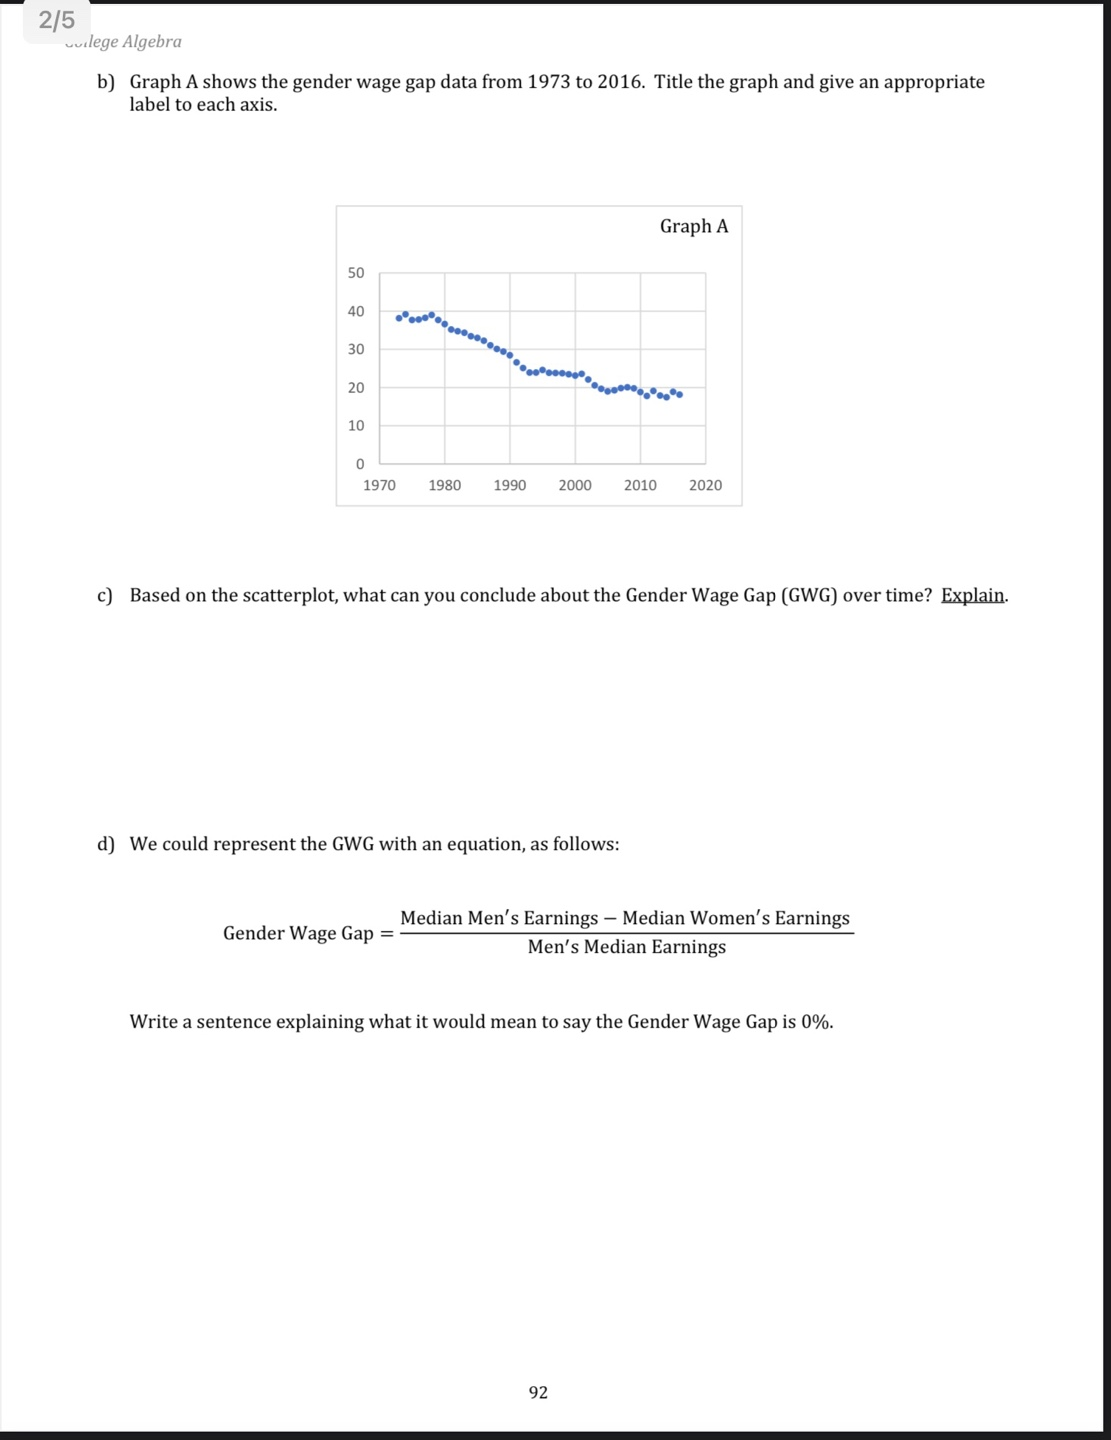
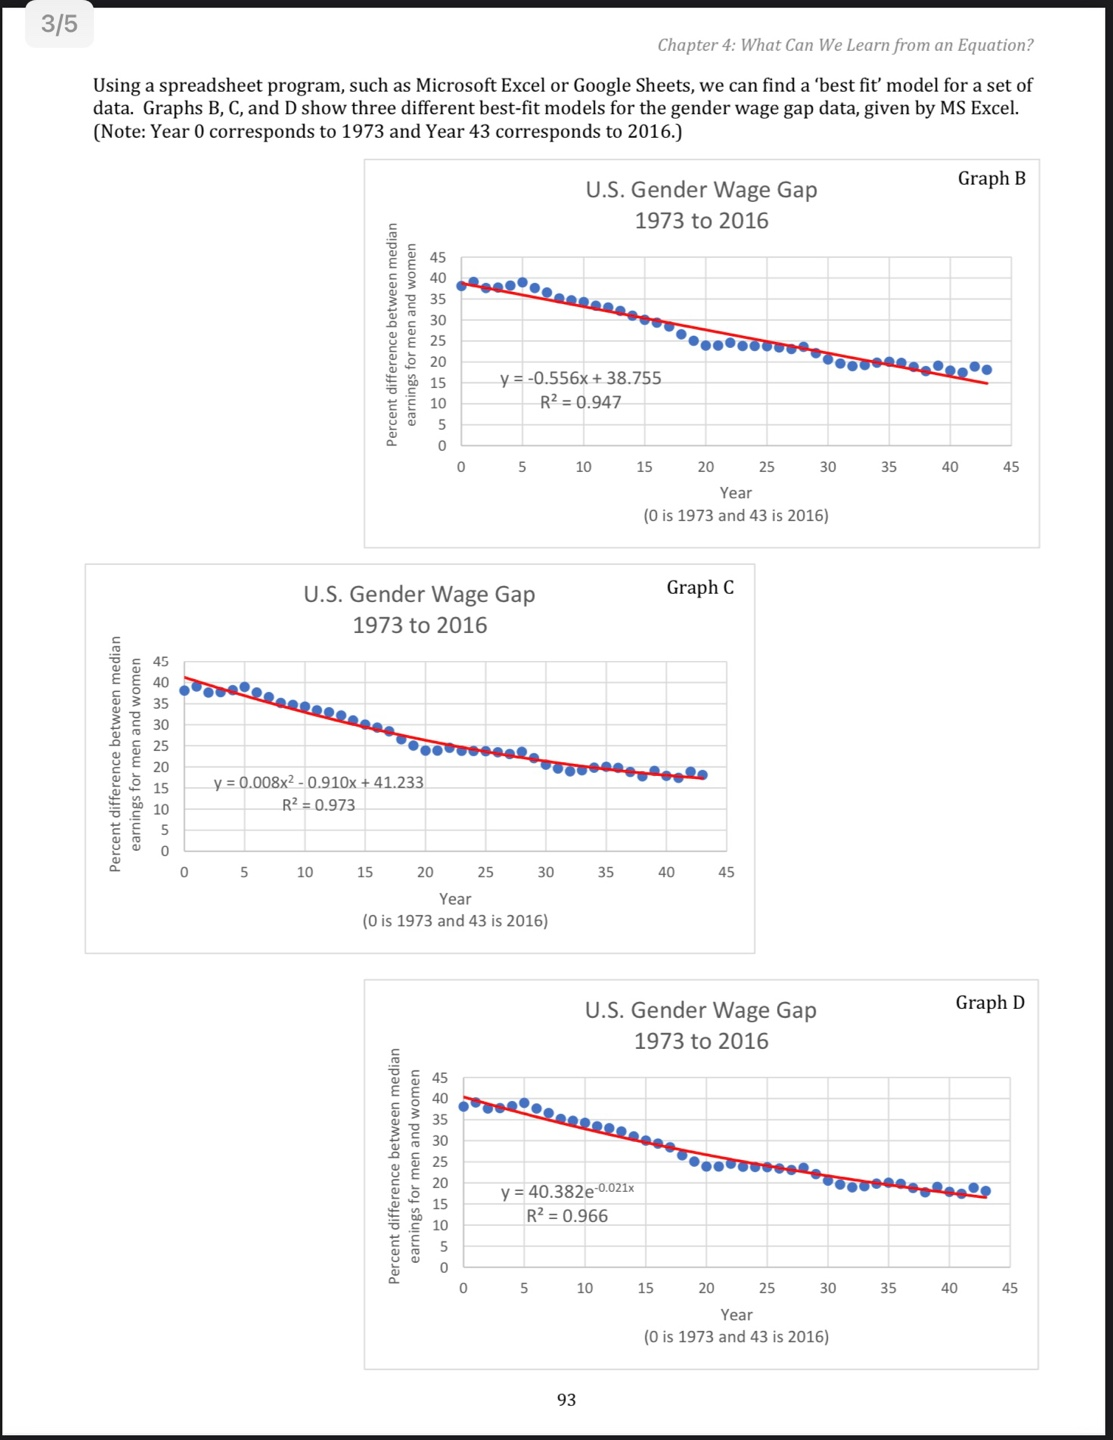
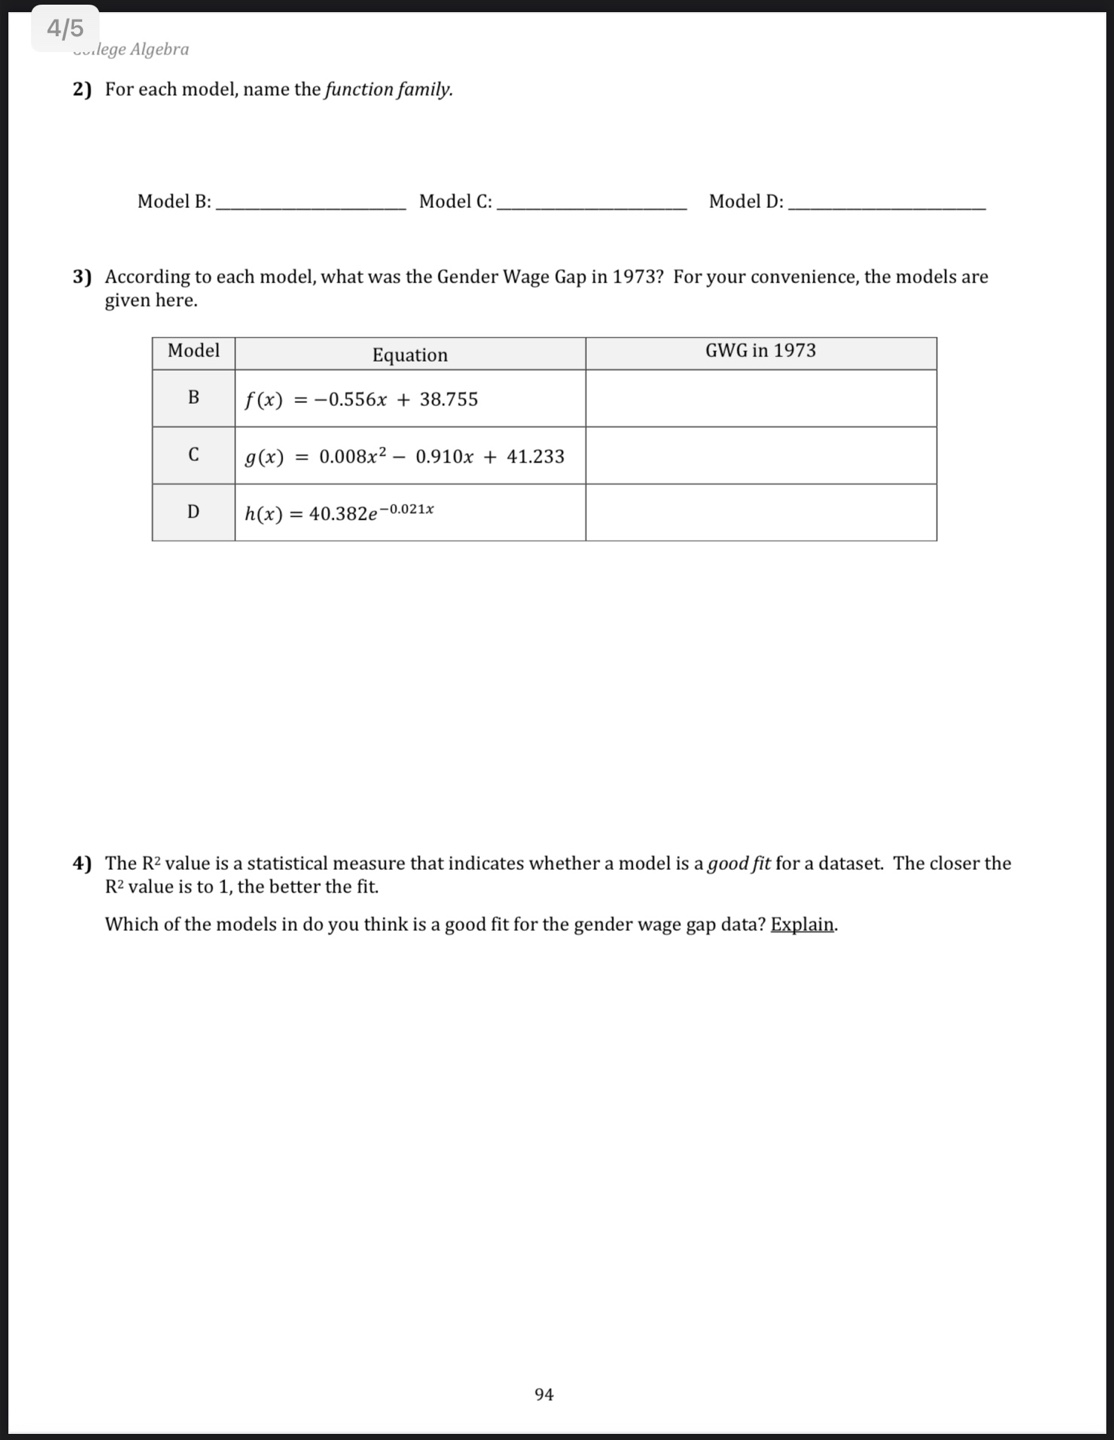
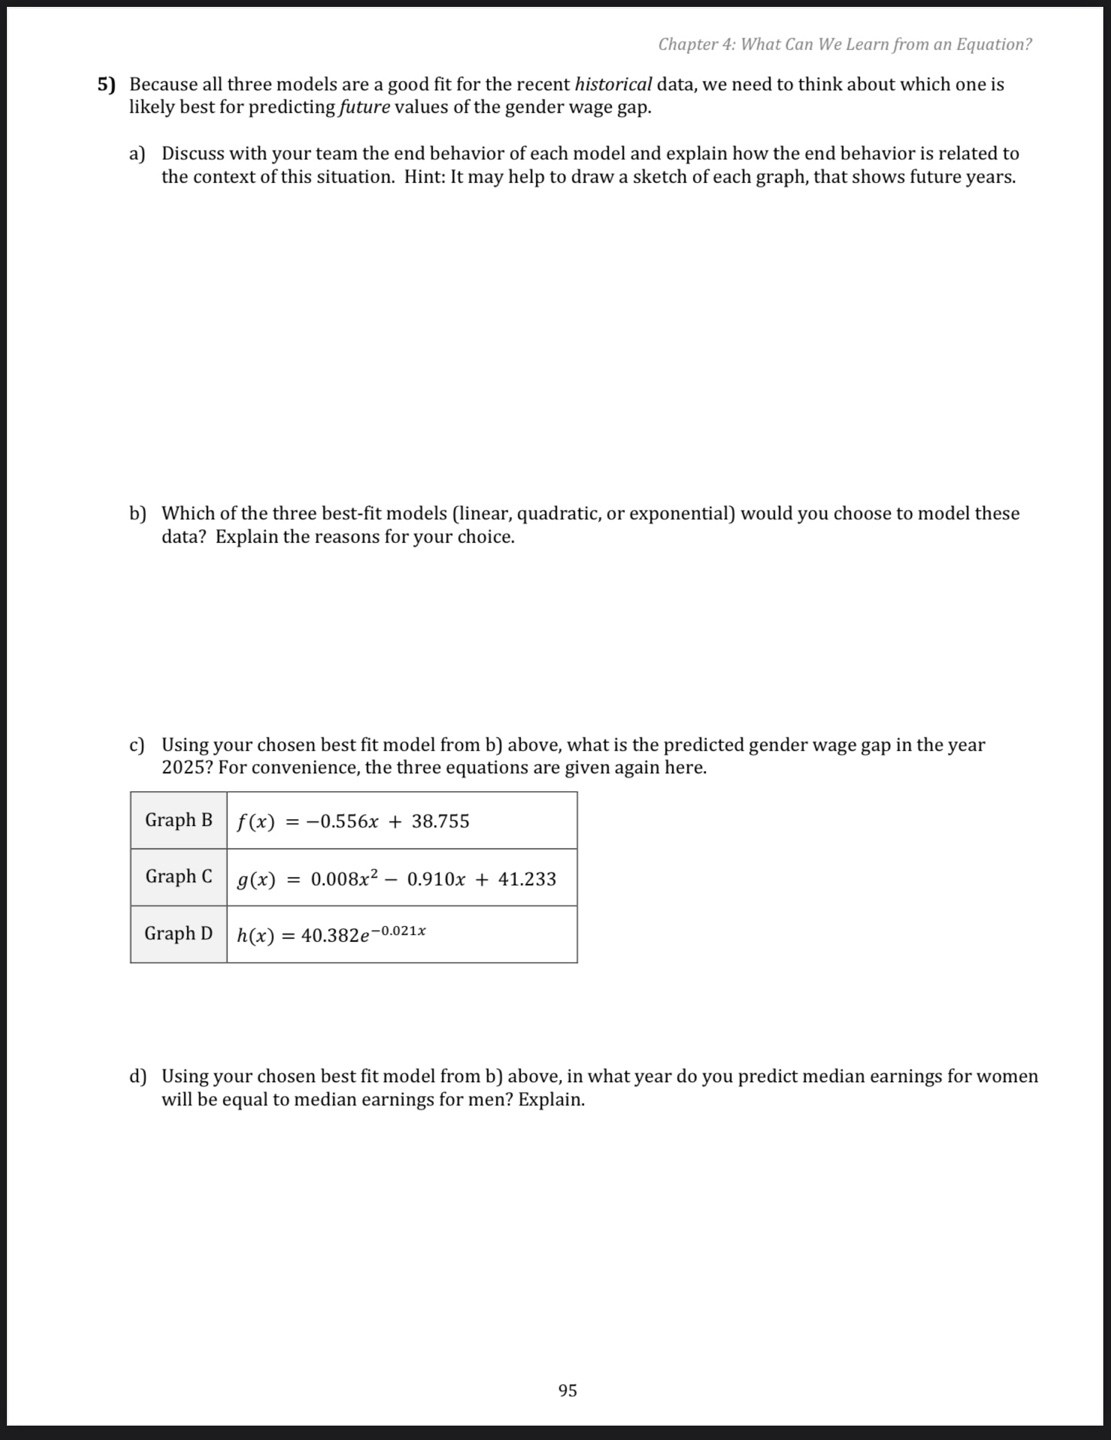
Chapter 4: What Can We Learn from an Equation? 4.3: Modeling Real-World Data Learning Objectives Together with your team: e Use the best-fit model from Microsoft Excel to model a real-world data set and use it to predict values not in the data set. Usea given equation of a function to interpret function values in the context of a given situation. s Use the graph or equation of the best-fit trend line to model a real-world data set and use it to predict values not in the data set. With your team to consider data about the U.S. gender wage gap, provided by the Organization for Economic Co- operation and Development (OECD). Table 1 U.S. Gender Wage Gap At their website, OECD provides data for the gender wage gap (see Table 1). The data in Table 1 defines a function, that takes the years 38.11% from 1973 to 2016 as input and gives the gender wage gap for that - year as output. 39.1% 37.63% We will use the following definition of Gender Wage Gap: 37.76% The difference between men''s and women''s median earnings as a percentage of men's median earnings. 38.22% 38.97% 37.64% 1) The data point (1973, 38.11%) tells us, in 1973 the gender wage gap was 38.11%; that is, the median earnings for women was 36.55% 38.11% less than the median earnings for men. _ ; ; 3 a) E._xplal_n what the data point (2016, 18.1%) tells you about the 2009 19.78% situation. 2010 18.81% 2011 17.79% 2012 19.09% 2013 17.91% 2014 2015 18.88% 2016 18.1% IJVIIIJS"_ff:J'JIJ iR (accessed 26 May 2018) 921 2/5 wuilege Algebra b) Graph A shows the gender wage gap data from 1973 to 2016. Title the graph and give an appropriate label to each axis. Graph A 50 40 30 20 10 1970 1980 1990 2000 2010 2020 c) Based on the scatterplot, what can you conclude about the Gender Wage Gap (GWG) over time? Explain. d) We could represent the GWG with an equation, as follows: Median Men's Earnings - Median Women's Earnings Gender Wage Gap = Men's Median Earnings Write a sentence explaining what it would mean to say the Gender Wage Gap is 0%. 923/5 Chapter 4: What Can We Learn from an Equation? Using a spreadsheet program, such as Microsoft Excel or Google Sheets, we can find a 'best fit' model for a set of data. Graphs B, C, and D show three different best-fit models for the gender wage gap data, given by MS Excel. (Note: Year 0 corresponds to 1973 and Year 43 corresponds to 2016.) Percent difference between median earnings for men and women Percent difference between median earnings for men and women Graph B U.S. Gender Wage Gap 1973 to 2016 45 40 35 30 25 20 = y = -0.556x + 38.755 e 10 R2=0.947 o w 0 5 10 15 20 25 30 35 40 45 Year (0is 1973 and 43 is 2016) U.S. Gender Wage Gap Graph C 1973 to 2016 y =0.008x2 - 0.910x + 41.233 R?=0.973 5 10 15 20 25 30 35 40 45 Year (0is 1973 and 43 is 2016) Percent difference between median earnings for men and women U.S. Gender Wage Gap Graph D 1973 to 2016 45 40 35 30 25 e y = 40.3820021x e o R? = 0.966 5 0 0 5 10 15 20 25 30 35 40 45 Year (0is 1973 and 43 is 2016) 93 4/5 . 2) For each model, name the function family. Model B: Model C: Model D: 3) According to each model, what was the Gender Wage Gap in 1973? For your convenience, the models are given here. Equation GWG in 1973 f(x) =0.556x + 38.755 g(x) = 0.008x%2 0.910x + 41.233 h(x) = 40.382~0.021x 4) The R2value is a statistical measure that indicates whether a model is a good fit for a dataset. The closer the Rz value is to 1, the better the fit. Which of the models in do you think is a good fit for the gender wage gap data? Explain. swtor d:- What Caon We T earn Feam aon FEaonatinn? nter 4: What Can We Learn from an Equation 5) Because all three models are a good fit for the recent historical data, we need to think about which one is likely best for predicting future values of the gender wage gap. a) Discuss with your team the end behavior of each model and explain how the end behavior is related to the context of this situation. Hint: It may help to draw a sketch of each graph, that shows future years. b) Which of the three best-fit models (linear, quadratic, or exponential) would you choose to model these data? Explain the reasons for your choice. ) Using your chosen best fit model from b) above, what is the predicted gender wage gap in the year 20257 For convenience, the three equations are given again here. Graph B | f(x) = 0.556x + 38.755 ' Graph C | g(x) = 0.008x? 0.910x + 41.233 ' ' Graph D | h(x) = 40.382-0021x ' d) Using your chosen best fit model from b) above, in what year do you predict median earnings for women will be equal to median earnings for men? Explain
Step by Step Solution
There are 3 Steps involved in it

Get step-by-step solutions from verified subject matter experts