

Question: Chapter 5 1. Give an example of a causal method of forecasting 2. What does a graphical plot showing sales on the Y axis and
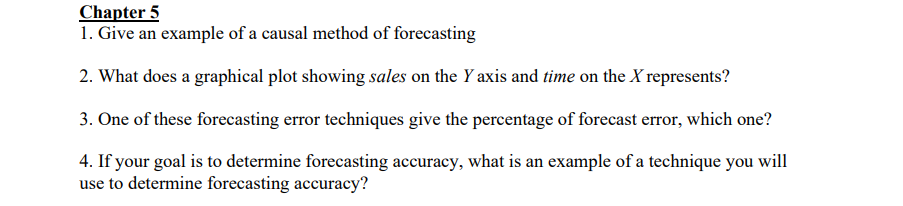
Chapter 5 1. Give an example of a causal method of forecasting 2. What does a graphical plot showing sales on the Y axis and time on the X represents? 3. One of these forecasting error techniques give the percentage of forecast error, which one'?I 4. If your goal is to determine forecasting accuracy, what is an example of a technique you will use to determine forecasting accuracy
Step by Step Solution
There are 3 Steps involved in it
1 Expert Approved Answer
Step: 1 Unlock

Question Has Been Solved by an Expert!
Get step-by-step solutions from verified subject matter experts
Step: 2 Unlock
Step: 3 Unlock