

Question: Chapter 5, Exercise 16: Write a program to draw a quiz score histogram. Your program should read data rom a file. Each line of the
Chapter 5, Exercise 16:
Write a program to draw a quiz score histogram. Your program should read data rom a file. Each line of the file contains a number in the range of 0-10. Your program must count the number of occurrences of each score and then draw a verticial bar chart for each possible score. For example, if 15 students each got an 8, then the height of the bar for 8 should be 15. Hint: use a list that stores the count for each possible score.
This is the code I have so far, can not get it to work, please help.
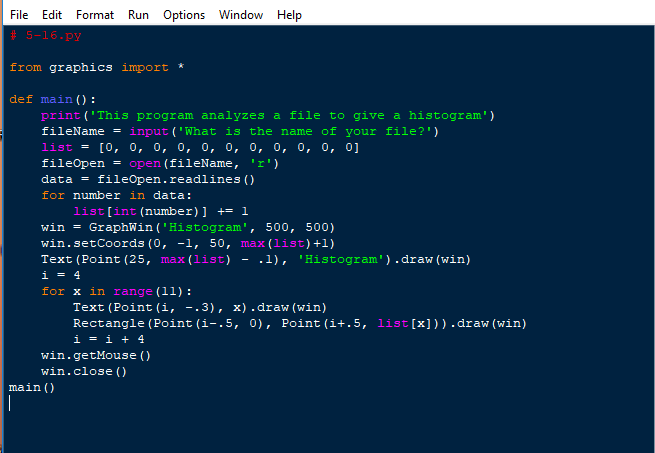
from graphics import *
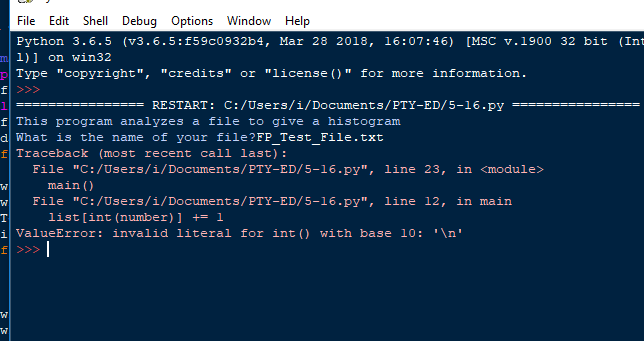
def main(): print('This program analyzes a file to give a histogram') fileName = input('What is the name of your file?') list = [0, 0, 0, 0, 0, 0, 0, 0, 0, 0, 0] fileOpen = open(fileName, 'r') data = fileOpen.readlines() for number in data: list[int(number)] += 1 win = GraphWin('Histogram', 500, 500) win.setCoords(0, -1, 50, max(list)+1) Text(Point(25, max(list) - .1), 'Histogram').draw(win) i = 4 for x in range(11): Text(Point(i, -.3), x).draw(win) Rectangle(Point(i-.5, 0), Point(i+.5, list[x])).draw(win) i = i + 4 win.getMouse() win.close() main()
In Screenshot:
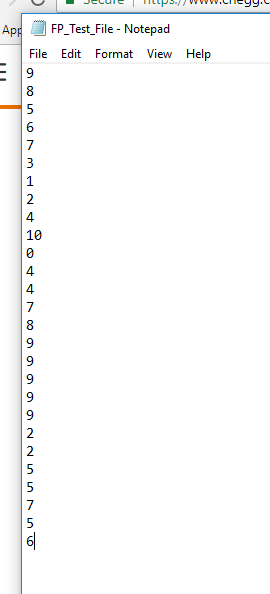
FP_Test_File.txt :
Step by Step Solution
There are 3 Steps involved in it

Get step-by-step solutions from verified subject matter experts