

Question: CHAPTER 5: FINANCIAL STATEMENT FORECASTING NVIDIA Corp. financial statements are presented below. Analysts forecast that its 2018 sales will be $8,260. The expected 2018 tax
 CHAPTER 5: FINANCIAL STATEMENT FORECASTING NVIDIA Corp. financial statements are presented below. Analysts forecast that its 2018 sales will be $8,260. The expected 2018 tax rate will be 17.35%.
a) Use your judgement to forecast the items on the income statement and balance sheet with the percent of sales method. What is the discretionary financing needed in 2018? Is this a surplus or deficit? Assume that the dividends per share will be $0.54 and the number of shares will be the same as in 2017.
b) Assume that DFN will be absorbed by long-term debt and that the interest rate is 2.5% of the sum of LTD and short-term debt. Set up an iterative worksheet to eliminate it.
c) Create a scatter chart of research and development vs. sales and add a linear trend line. Does there appear to be a consistent trend in this relationship?
d) Use the regression tool to verify your results from part c. Is the trend statistically significant? Use the three criteria covered in class.
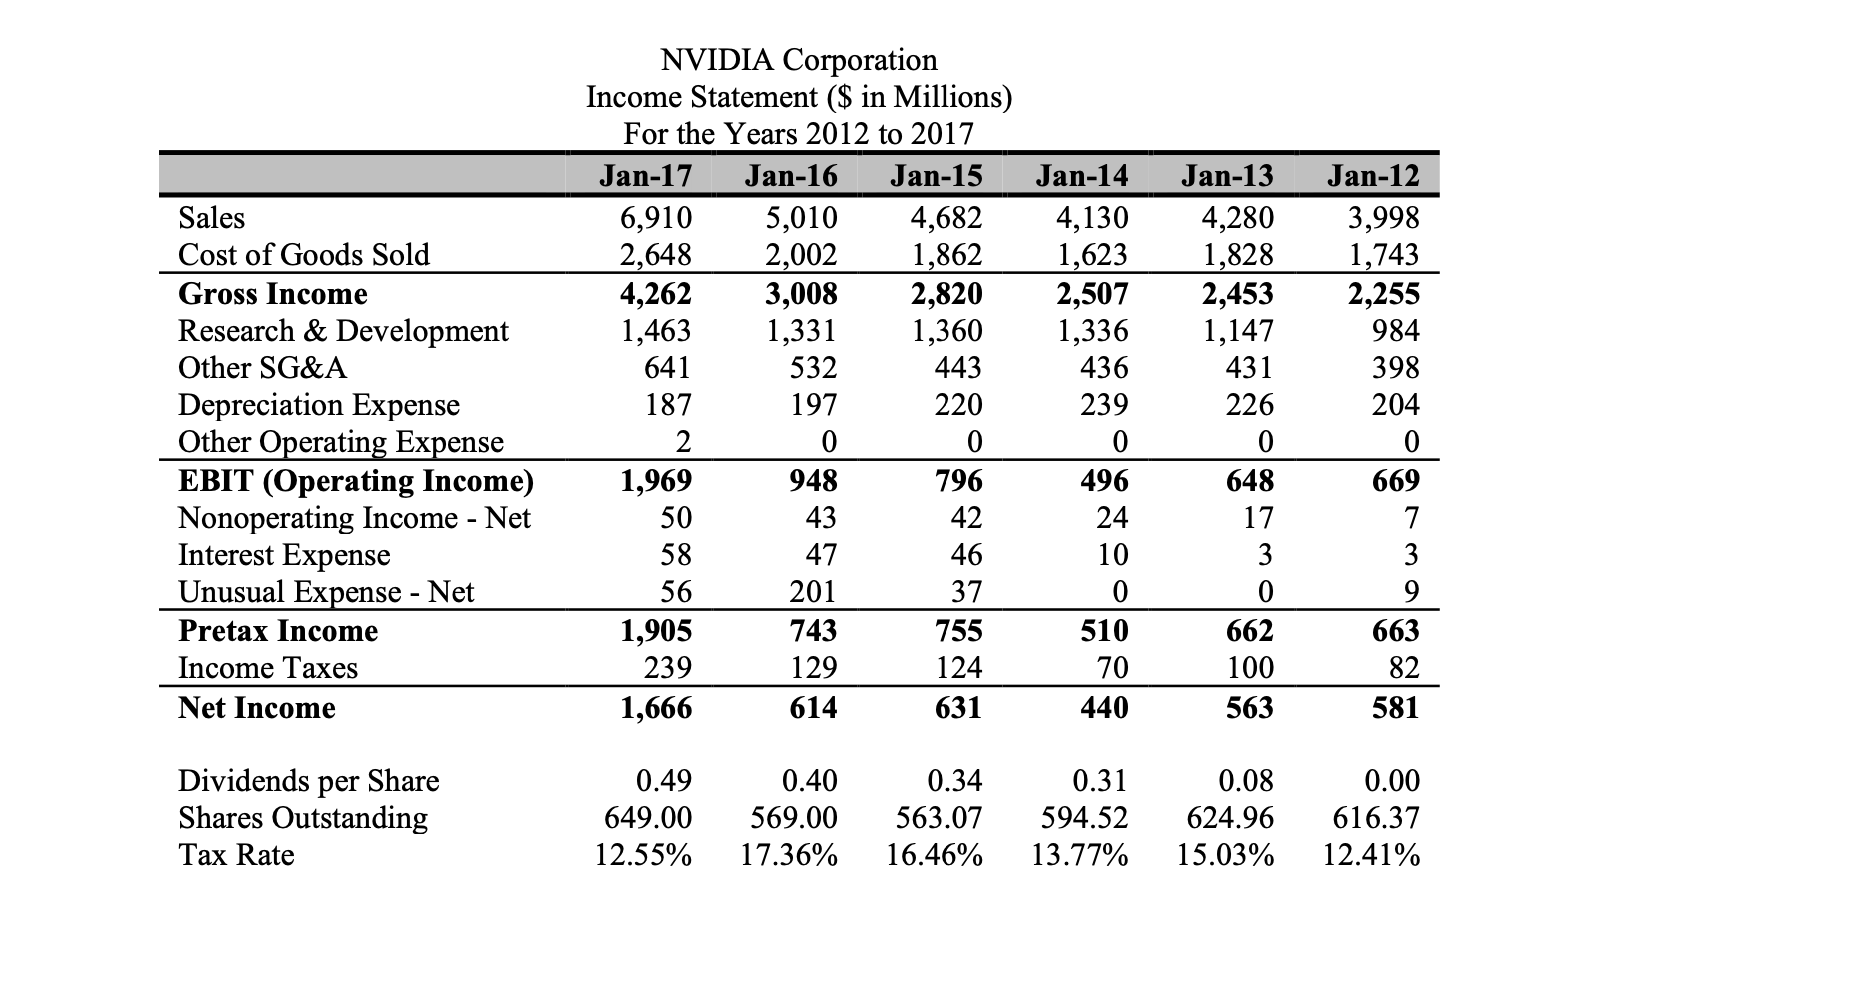
Sales Cost of Goods Sold Gross Income Research & Development Other SG&A Depreciation Expense Other Operating Expense EBIT (Operating Income) Nonoperating Income - Net Interest Expense Unusual Expense - Net Pretax Income Income Taxes Net Income NVIDIA Corporation Income Statement ($ in Millions) For the Years 2012 to 2017 Jan-17 Jan-16 Jan-15 6,910 5,010 4,682 2,648 2,002 1,862 4,262 3,008 2,820 1,463 1,331 1,360 641 532 443 187 197 220 2 0 1,969 948 796 50 43 42 58 47 46 56 201 37 1,905 743 755 239 129 124 1,666 614 631 Jan-14 4,130 1,623 2,507 1,336 436 239 0 496 24 10 0 510 70 440 Jan-13 4,280 1,828 2,453 1,147 431 226 0 648 17 3 0 662 100 563 Jan-12 3,998 1,743 2,255 984 398 204 0 669 7 3 9 663 82 581 Dividends per Share Shares Outstanding Tax Rate 0.49 649.00 12.55% 0.40 569.00 17.36% 0.34 563.07 16.46% 0.31 594.52 13.77% 0.08 624.96 15.03% 0.00 616.37 12.41% Sales Cost of Goods Sold Gross Income Research & Development Other SG&A Depreciation Expense Other Operating Expense EBIT (Operating Income) Nonoperating Income - Net Interest Expense Unusual Expense - Net Pretax Income Income Taxes Net Income NVIDIA Corporation Income Statement ($ in Millions) For the Years 2012 to 2017 Jan-17 Jan-16 Jan-15 6,910 5,010 4,682 2,648 2,002 1,862 4,262 3,008 2,820 1,463 1,331 1,360 641 532 443 187 197 220 2 0 1,969 948 796 50 43 42 58 47 46 56 201 37 1,905 743 755 239 129 124 1,666 614 631 Jan-14 4,130 1,623 2,507 1,336 436 239 0 496 24 10 0 510 70 440 Jan-13 4,280 1,828 2,453 1,147 431 226 0 648 17 3 0 662 100 563 Jan-12 3,998 1,743 2,255 984 398 204 0 669 7 3 9 663 82 581 Dividends per Share Shares Outstanding Tax Rate 0.49 649.00 12.55% 0.40 569.00 17.36% 0.34 563.07 16.46% 0.31 594.52 13.77% 0.08 624.96 15.03% 0.00 616.37 12.41%
Step by Step Solution
There are 3 Steps involved in it

Get step-by-step solutions from verified subject matter experts