Question: Chapter 6: Case Study #43:The financial information in Figures 6-7 through 6-10 was extracted from Granite Construction Incorporated's 2003 annual (10-K) report filed with the
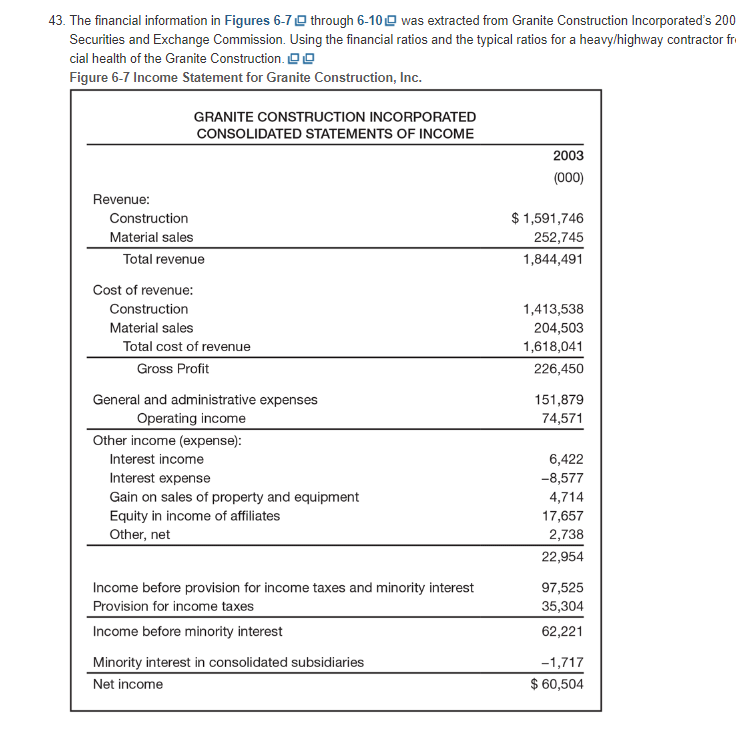
Chapter 6: Case Study #43:The financial information in Figures 6-7 through 6-10 was extracted from Granite Construction Incorporated's 2003 annual (10-K) report filed with the Securities and Exchange Commission. Using the financial ratios and the typical ratios for a heavy/highway contractor from this chapter, analyze the financial health of Granite Construction. FIGURE 6-7 Income Statement for Granite Construction, Inc.
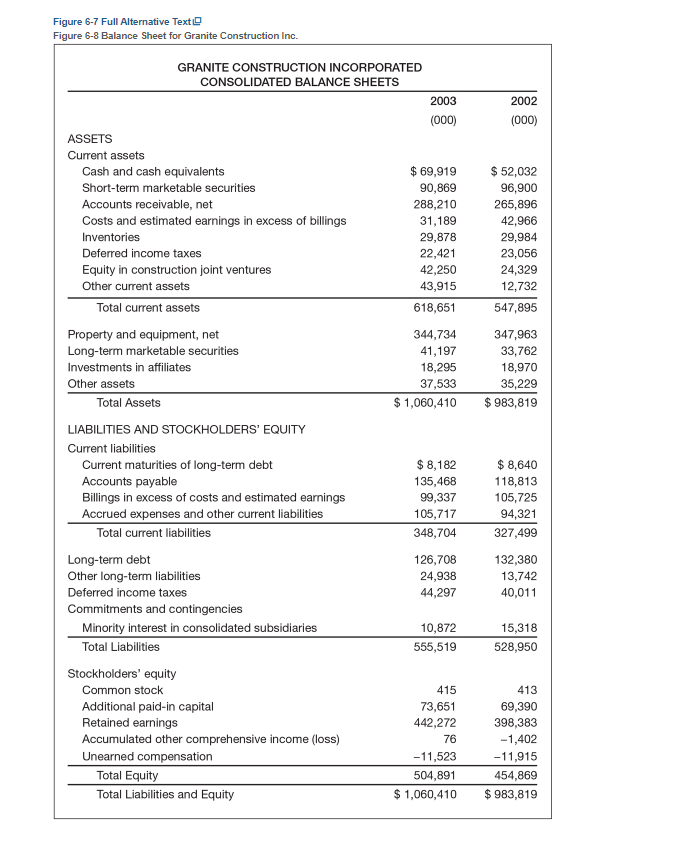
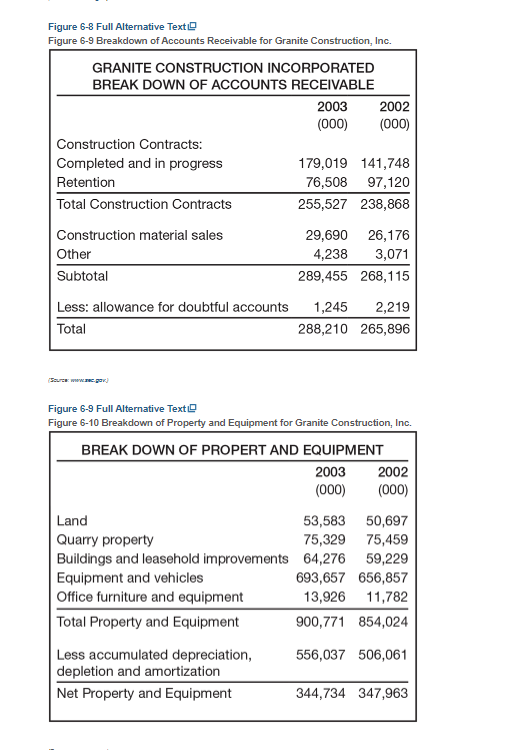
43. The financial information in Figures 6-7 0 through 6-102 was extracted from Granite Construction Incorporated's 200 Securities and Exchange Commission. Using the financial ratios and the typical ratios for a heavy/highway contractor fri cial health of the Granite Construction. |0 (20 Figure 6-7 Income Statement for Granite Construction, Inc. GRANITE CONSTRUCTION INCORPORATED CONSOLIDATED STATEMENTS OF INCOME 2003 {000) Revenue: Construction $ 1,591,746 Material sales 252,745 Total revenue 1,844 491 Cost of revenue: Construction 1,413,538 Material sales 204,503 Total cost of revenue 1,618,041 Gross Profit 226,450 General and administrative expenses 151,879 Operating income 74,571 Other income (expense): Interest income 6,422 Interest expense -8,577 Gain on sales of property and eguipment 4,714 Equity in income of affiliates 17,657 Other, net 2,738 22,954 Income before provision for income taxes and minority interest 97,525 Provision for income taxes 35,304 Income before minority interest 62,221 Minerity interest in consolidated subsidiaries -1,717 Met income $ 60,504 Figure 6-7 Full Alternative Text Figure 6-8 Balance Sheet for Granite Construction Inc. GRANITE CONSTRUCTION INCORPORATED CONSOLIDATED BALANCE SHEETS 2003 2002 (000) 000 ASSETS Current assets Cash and cash equivalents $ 69,919 $ 52,032 Short-term marketable securities 90,869 96,900 Accounts receivable, net 288,210 265,896 Costs and estimated earnings in excess of billings 31,189 42,966 Inventories 29,878 29,984 Deferred income taxes 22,421 23,056 Equity in construction joint ventures 42,250 24,329 Other current assets 43,915 12,732 Total current assets 618,651 547,895 Property and equipment, net 344,734 347,963 Long-term marketable securities 41,197 33,762 Investments in affiliates 18,295 18,970 Other assets 37,533 35,229 Total Assets $ 1,060,410 $ 983,819 LIABILITIES AND STOCKHOLDERS' EQUITY Current liabilities Current maturities of long-term debt $ 8,182 $ 8,640 Accounts payable 135,468 118,813 Billings in excess of costs and estimated earnings 99,337 105,725 Accrued expenses and other current liabilities 105,717 94,321 Total current liabilities 348,704 327,499 Long-term debt 126,708 132,380 Other long-term liabilities 24,938 13,742 Deferred income taxes 44,297 40,011 Commitments and contingencies Minority interest in consolidated subsidiaries 10,872 15,318 Total Liabilities 555,519 528,950 Stockholders' equity Common stock 415 13 Additional paid-in capital 73,651 69,390 Retained earnings 442,272 398,383 Accumulated other comprehensive income (loss) 76 -1,402 Unearned compensation -11,523 -11,915 Total Equity 504,891 154,869 Total Liabilities and Equity $ 1,060,410 $ 983,81Figure 8-8 Full Alternative Text|D Figure &-9 Breakdown of Accounts Receivable for Granite Construction, Inc. GRANITE CONSTRUCTION INCORPORATED BREAK DOWN OF ACCOUNTS RECEIVABLE 2003 2002 {000) (000) Construction Contracts: Completed and in progress 179,019 141,748 Retention 76,508 97,120 Total Construction Contracts 235,527 238,868 Construction material sales 29,690 26,176 Other 4,238 3,07 Subtotal 288,455 268,115 Less: allowance for doubtful accounts 1,245 2,219 Total 288,210 265,896 Towroe: e GO Figure 8-89 Full Alternative Text (O Figure &-10 Breakdown of Property and Equipment for Granite Construction, Inc. BREAK DOWN OF PROPERT AND EQUIPMENT 2003 2002 {000) (000) Land 53,583 50,697 Quarry property 75,329 75,459 Buildings and leasehold improvements 64,276 59,229 Equipment and vehicles 693,667 656,857 Office furniture and equipment 13,926 11,782 Total Property and Equipment 900,771 854,024 Less accumulated depreciation, 556,037 506,061 depletion and amortization Met Property and Eguipment 344,734 347,963
Step by Step Solution
There are 3 Steps involved in it
1 Expert Approved Answer
Step: 1 Unlock
Question Has Been Solved by an Expert!
Get step-by-step solutions from verified subject matter experts
Step: 2 Unlock
Step: 3 Unlock
Students Have Also Explored These Related Finance Questions!